CAC 40 Showing Bearish Signs Towards 7600 LevelToday, the CAC 40 index is showing signs of being bearish as it is currently trading lower than its previous closing price. This downward trend suggests that we may see a further decline towards the 7600 level in the near future.
**Disclaimer: This analysis is not financial advice and should not be taken as such. It is based solely on my own interpretation of the market data and should be used for informational purposes only.**
FRA40 trade ideas

LONG FRA40I could make up a bunch of stuff to make you believe in my setups. The truth is my analysis doesn't matter. I could have flipped and coin and made up anything lol. Anyways, this is my trading setup. Letting the lines do all the speaking. Have a blessed day.

CAC40 may rise to 7700.00 - 7748.00Pivot
7624.00
Our preference
Long positions above 7624.00 with targets at 7700.00 & 7748.00 in extension.
Alternative scenario
Below 7624.00 look for further downside with 7600.00 & 7574.00 as targets.
Comment
The RSI is mixed and calls for caution.
Supports and resistances
7760.00
7748.00
7700.00
7681.50 Last
7624.00
7600.00
7574.00
Number of asterisks represents the strength of support and resistance levels.

French Index to rally 8% in wave iii The CAC40 has begun its up journey in what is being labeled currently as wave iii of WAVE 3.
This particular sub-dividing leg is projected moving towards EUR8100-8150 zone.
The final projected target zone for the bigger wave 3 however comes in at a much higher level of EUR 8750.

Building a Solid Portfolio: Using an Index (THE CAC 40 INDEX)Hello,
Embarking on the journey of creating a portfolio of stocks can be both exciting and challenging. One strategy that many investors consider is using a well-established index as a basis for their portfolio. In this article, we will explore the steps involved in building a portfolio with the CAC 40 Index, a benchmark index representing the 40 largest stocks listed on Euronext Paris.
Step 1: Understand the index.
Understanding an index is very key since it creates the thesis of why you should consider using it. In our case, the simplest definition of the CAC 40 index is as below
The CAC 40 is a benchmark French stock market index. The index represents a capitalization-weighted measure of the 40 most significant stocks among the 100 largest market caps on the Euronext Paris.
2: Define your investment goals
whether you are looking at strong companies that will provide consistent dividends for you or strong companies that will easily deliver price appreciation for your stocks will be very key in your next move.
Understanding your risk horizon & tolerance is also very important at this stage.
3: Understand the components of the Index.
The CAC 40 has 40 companies as its components. The companies are as follows;
Air Liquide, Airbus, Alstom, ArcelorMittal, Axa, BNP Paribas, Bouygues, Capgemini, Carrefour, Crédit Agricole, Danone, Dassault Systèmes, Edenred, Engie, EssilorLuxottica, Eurofins Scientific, Hermès, Kering, L'Oréal, Legrand, LVMH, Michelin, Orange, Pernod Ricard, Publicis, Renault, Safran, Saint-Gobain, Sanofi, Schneider Electric, Société Générale, Stellantis, STMicroelectronics, Teleperformance, Thales, TotalEnergies, Unibail-Rodamco-Westfield, Veolia, Vinci, and Worldline
4: Research Individual Companies
Once you have a sense of the companies you want exposure to, delve into the individual companies. Conduct thorough research on each company, considering factors such as financial health, earnings growth, competitive positioning, and management quality. This step is crucial in identifying the specific stocks you want to include in your portfolio. This will greatly help you in selecting the great companies among the components. We will look at 1 company among the components of the CAC 40 & you can try and look at the rest.
The company we shall explore is DANONE . Below is its chart to show its historical price move
Next understand what the company does: Danone SA engages in the food processing industry. It operates through the following geographical segments: Europe; North America; China, North Asia & Oceania; and Rest of the World. . This data can be found on Tradingview via link www.tradingview.com
Next understand the financials of the company: The same can be interrogated on the link shared before. The most important metric is the Income statement because it shows you where the company derives its value from in form of income. It also will tell you how the company spends its money. You cannot however ignore the Balance sheet and the Cashflow statement. www.tradingview.com
Once you have an understanding of the company as a whole now its key to look at structure to understand and pick great entry points. This is where we begin structure drawing and identification of patterns.
Here is the link with clear Impulses & corrections.
Very key for you to note is that the price is in a correction and close to where the 1st target would be. This tells us even though this might be a great company from all other metrics, it might not be a great company to buy from the current point. Now that we have looked at the Danone company, back to our CAC 40 index.
5: Research on all other companies that make the index.
By following these above steps, you can construct a well-rounded portfolio that aligns with your financial goals and risk tolerance.
All the best in your investment journey.

Identifying a Short-Term Sell Opportunity: CAC 40 Correction
Introduction:
In the dynamic world of financial markets, staying ahead of trends is crucial for successful trading. Technical analysis serves as a powerful tool for identifying potential opportunities, and currently, the CAC 40 index is exhibiting signs of a correction, forming a wedge pattern that could indicate a short-term sell opportunity.
Understanding the Wedge Pattern:
The wedge pattern is a common formation in technical analysis that signals a potential reversal or continuation of a trend. In the case of the CAC 40, a wedge pattern appears to be taking shape, indicating a possible impending correction. This pattern typically consists of converging trendlines, with either an ascending or descending slant.
Analyzing the CAC 40 Wedge:
As of the latest market data, the CAC 40 index is showing signs of a bearish wedge pattern, suggesting that a short-term sell opportunity might be on the horizon. This pattern often implies a decrease in momentum and a potential shift in the prevailing trend. Traders and investors should carefully analyze the following key aspects:
Trendline Convergence: Monitor the points where the upper and lower trendlines of the wedge pattern converge. This convergence may act as a significant support or resistance level, influencing the index's future direction.
Volume Analysis: Pay attention to trading volumes accompanying the formation of the wedge pattern. A decrease in volume during the pattern formation may suggest a loss of interest or conviction in the current trend, reinforcing the potential for a reversal.
Technical Indicators: Utilize relevant technical indicators, such as the Relative Strength Index (RSI) or Moving Averages, to confirm the strength of the wedge pattern. Divergence or confirmation from these indicators can provide additional insights into the market sentiment.
Identifying Short-Term Sell Opportunities:
Given the formation of the bearish wedge pattern on the CAC 40, traders may consider the following strategies for capitalizing on a potential short-term sell opportunity:
Short Positions: As the index approaches the apex of the wedge pattern, consider initiating short positions, anticipating a downward price movement. Set appropriate stop-loss orders to manage risk effectively.
Option Strategies: Employ options strategies, such as buying put options or using bearish spreads, to take advantage of the anticipated downward movement while limiting potential losses.
Monitor Economic Events: Keep a close eye on upcoming economic events, corporate announcements, or geopolitical developments that could influence market sentiment and potentially accelerate the correction.
Conclusion:
In the ever-changing landscape of financial markets, traders and investors must adapt to evolving patterns and trends. The identification of a bearish wedge pattern on the CAC 40 index serves as a valuable signal for a potential short-term sell opportunity. However, it's essential to exercise caution, conduct thorough analysis, and implement risk management strategies to navigate the markets successfully.

CAC40 : REBOUND OR TREND REVERSAL ?- Prices have been trading upwards since the end of October 2023, the market is therefore in a medium-term bullish trend.
- Very recently, and since the establishment of a new all-time high below 7,655.0pts, the market has retraced towards its double support at 7,400.0pts. Prices are now trading below the two 13- and 21-period exponential moving averages, which have nevertheless not yet recorded any bearish crossover.
The DMI indicator shows an increase in selling pressure, but within a less and less directional movement.
- Despite the recent pull-back, the situation is not yet really dangerous for the French index. Indeed, a retracement following a strong rally that led prices to a new historic high point is even seen as something healthy at this point. This may be symbolized by the taking of profits by certain investors as well as a way of testing a newly established support level.
This new support level is also significant because it is made up of a double overlap (last peak + dotted downward trend line). Furthermore, the fall in directionality given by the DMI indicator also demonstrates a price movement that is not really significant in the very short term.
In conclusion, as long as the level of 7,400.0 points holds, the scenario of the continuation of the bullish movement started a few months ago should continue.

FR40EUR to find sellers at market levels?FR40EUR - 24h expiry
There is no clear indication that the downward move is coming to an end.
Risk/Reward would be poor to call a sell from current levels.
Short term RSI is moving lower.
A move through 7400 will confirm the bearish momentum.
The measured move target is 7350.
We look to Sell at 7450 (stop at 7490)
Our profit targets will be 7350 and 7330
Resistance: 7450 / 7475 / 7490
Support: 7400 / 7370 / 7350
Risk Disclaimer
The trade ideas beyond this page are for informational purposes only and do not constitute investment advice or a solicitation to trade. This information is provided by Signal Centre, a third-party unaffiliated with OANDA, and is intended for general circulation only. OANDA does not guarantee the accuracy of this information and assumes no responsibilities for the information provided by the third party. The information does not take into account the specific investment objectives, financial situation, or particular needs of any particular person. You should take into account your specific investment objectives, financial situation, and particular needs before making a commitment to trade, including seeking advice from an independent financial adviser regarding the suitability of the investment, under a separate engagement, as you deem fit.
You accept that you assume all risks in independently viewing the contents and selecting a chosen strategy.
Where the research is distributed in Singapore to a person who is not an Accredited Investor, Expert Investor or an Institutional Investor, Oanda Asia Pacific Pte Ltd (“OAP“) accepts legal responsibility for the contents of the report to such persons only to the extent required by law. Singapore customers should contact OAP at 6579 8289 for matters arising from, or in connection with, the information/research distributed.

CAC40 1HPossible bullish head and shoulder pattern on this low timeframe, higher timeframes bullish signals. BH&S pattern average violation of neckline is around 70% distance of pattern, if breakout- up after 70% anticipate no pullback to test breakout line. Lower timeframes like 15m and 5 min will be used to gauge bullish/bearish momentum around neckline. Always consider all possible moves the price can make. Head to right shoulder creates triangle pattern, alternative setup is to trade a bearish breakout-down from triangle pattern.

target 4400French empire still exists secretly in africa.
french equities moving nicely within a channel
I expect asset prices to fall in the coming years
but i give the central planners credit for maintaining
inflated asset prices for so long. But then again
adjusted for real inflation equities havent gone
anywhere in years.

F40 Cash Index- In Bullish ContinuationF40 Cash Index is making a Bullish Continuation pattern as there is a Bullish Flag and also there is no divergence.

FRANCE40 forecastRSI few days ago was record high 82 on daily chart, which means the market heavily overbought. No market is going up constantly. Correction is expected to happen anytime, with two potential targets at 20EMA or 50EMA.
I don't believe the approach of soft landing on recession. In my opinion the recession will come and when it comes, it will hit hard.
It's normal for markets to rally at the end of the year, statistically beginning of January is a little cooling off period.
*This is not a trading advice. Trading is risky. Always do your own analysis before entering the market.*

Est-il possible?I belive #LVMH driven french rally came to the end. After Santa is back to home, CAC40 will free fall

Anticipating a Potential Reversal as it Approaches ResistanceOne of the primary reasons supporting the notion of a potential market reversal is the historical price resistance at the 7580 level. Chart analysis reveals that the CAC40 has struggled to sustainably breach this level in the past, with multiple failed attempts resulting in bearish reversals. As the index approaches this critical resistance zone, traders and investors may exercise caution and opt for profit-taking strategies, leading to downward pressure.

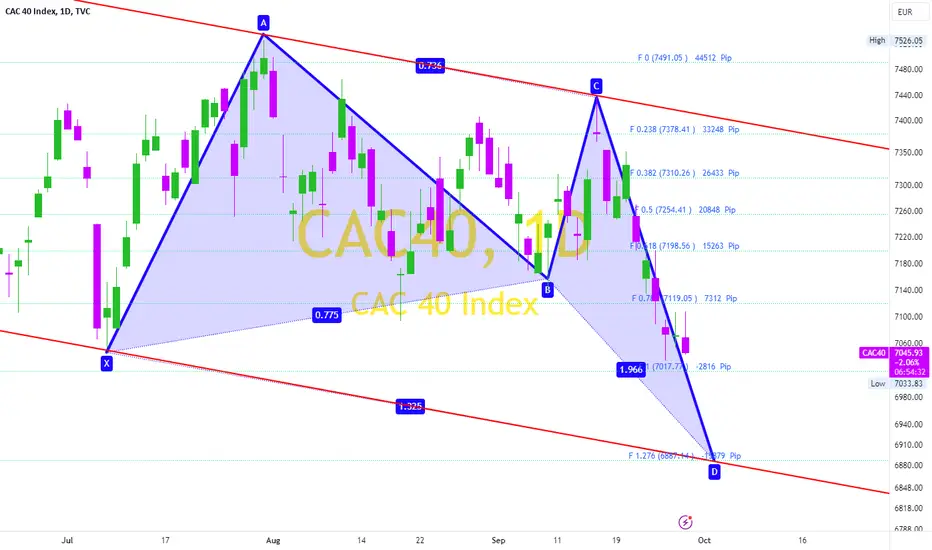
CAC Butterfly 🦋 Is Trapped in a Cylindrical Cagethe detail is shown in the above chart.
I made this Idea based on Descending Channel Analysis and Harmonic pattern using Fibonacci tools.
Bullish Butterfly Pattern Will Start at 6.9k
CAC Butterfly Needs correction before flying into Sky.
butterfly wing likely will Touch edge of the Channel.
M bearish opinion on FE40It is not recommendation but just my opinion
I believe that we are going to see bearish market for 1-2 weeks

10 Reasons Why News And Events Dont Impact Trading IndexesWhile news and events typically have a significant impact on trading indexes, there can be situations where certain factors mitigate or dampen their influence. Here are 10 hypothetical reasons why news and events might not have a substantial impact on trading indexes, considering the context provided earlier:
1. Market Stability: In a period of overall market stability, where there are no major economic concerns or geopolitical tensions, news and events may have a limited impact on index movements.
2. Prevalence of Technical Analysis: Traders relying heavily on technical analysis may prioritize historical price patterns, trends, and technical indicators over current news and events when making trading decisions.
3. Long-Term Investment Horizon: Investors with a long-term perspective may choose to overlook short-term news fluctuations, believing in the overall upward trajectory of the market over time.
4. Limited Exposure to News Sources: Traders who have limited exposure to news sources or who do not actively monitor real-time news updates may not be immediately influenced by breaking news.
5. Low Market Participation: During periods of low trading volumes or reduced market participation, the impact of news and events on indexes may be less pronounced.
6. Index Composition: If the majority of stocks in an index are relatively insulated from the effects of specific news or events, the overall impact on the index may be minimal.
7. Anticipation of Events:If news or events are widely anticipated and already factored into market expectations, their actual occurrence may have a muted effect on index movements.
8. Global Economic Factors:In a scenario where global economic factors have a more dominant influence on index movements than local news and events, the impact of the latter may be overshadowed.
9. Consistent Economic Indicators: If economic indicators consistently show positive or stable conditions, short-term fluctuations driven by news events may be viewed as less significant in the broader economic context.
10. Investor Sentiment: In situations where investor sentiment remains relatively unchanged despite news developments, the impact on trading indexes may be limited. Investor sentiment can sometimes act as a counterbalance to immediate news reactions.
It's essential to recognize that these reasons are hypothetical, and in practice, news and events often play a crucial role in shaping market movements. Traders and investors should stay informed about relevant news and events, as sudden developments can significantly impact market dynamics and influence trading decisions.
Risk Warning:
Trading in financial markets carries a risk of substantial financial loss and is not suitable for every investor. Users should be aware of the risks associated with trading and are urged to seek advice from an independent financial advisor if they have any doubts.
Trading Disclaimer:
The information provided on this platform is for educational purposes only and should not be considered as financial advice. Trading financial instruments involves risk, and past performance is not indicative of future results. Users should carefully consider their financial situation, risk tolerance, and investment objectives before engaging in any trading activities.
No Financial Advice:
The information provided on this platform is not intended as financial advice. Users should seek professional advice from a qualified financial advisor before making any financial decisions.
No Guarantee of Profit:
Trading strategies, analyses, or recommendations provided are not guaranteed to result in profits. Individual trading outcomes may vary, and users may experience losses.

France40 to continue in the upward move?FRA40 - 24h expiry
There is no clear indication that the upward move is coming to an end.
Dips continue to attract buyers.
Risk/Reward would be poor to call a buy from current levels.
A move through 7300 will confirm the bullish momentum.
The measured move target is 7350.
We look to Buy at 7240 (stop at 7196)
Our profit targets will be 7350 and 7375
Resistance: 7300 / 7340 / 7350
Support: 7240 / 7200 / 7175
Risk Disclaimer
The trade ideas beyond this page are for informational purposes only and do not constitute investment advice or a solicitation to trade. This information is provided by Signal Centre, a third-party unaffiliated with OANDA, and is intended for general circulation only. OANDA does not guarantee the accuracy of this information and assumes no responsibilities for the information provided by the third party. The information does not take into account the specific investment objectives, financial situation, or particular needs of any particular person. You should take into account your specific investment objectives, financial situation, and particular needs before making a commitment to trade, including seeking advice from an independent financial adviser regarding the suitability of the investment, under a separate engagement, as you deem fit.
You accept that you assume all risks in independently viewing the contents and selecting a chosen strategy.
Where the research is distributed in Singapore to a person who is not an Accredited Investor, Expert Investor or an Institutional Investor, Oanda Asia Pacific Pte Ltd (“OAP“) accepts legal responsibility for the contents of the report to such persons only to the extent required by law. Singapore customers should contact OAP at 6579 8289 for matters arising from, or in connection with, the information/research distributed.

CAC40 :WOLFE.W+SHARK+Strong Henry-DavidCAC 40: 3 strong signals detected: WOLFE wave + SHARK + Strong HENRY-DAVID.
The EMA.50 and EMA.200 are potential targets.
To see: Fibonacci, ICHIMOKU and Bollinger levels
Wolfe's ascending wave is confirmed: TP1 has already been reached.

Fra40 Bullish?Analising the FRA40 we got a high probability to have a bullish market the price is near fibonacci 0,764 we got a support level in weekly charts we need a candlestick pattern to enter in trade in daily charts.
MME 200 is a very nice support for weekly charts suporting a bullish movement
Target 7300

FR40 to turnaround at previous stem dip?FRA40 - 24h expiry
Price action looks to be forming a bottom.
We expect a reversal in this move.
A move through 7025 will confirm the bullish momentum.
Short term RSI has turned positive.
The measured move target is 7050.
We look to Buy at 6950 (stop at 6890)
Our profit targets will be 7100 and 7140
Resistance: 7025 / 7050 / 7075
Support: 6975 / 6950 / 6925
Risk Disclaimer
The trade ideas beyond this page are for informational purposes only and do not constitute investment advice or a solicitation to trade. This information is provided by Signal Centre, a third-party unaffiliated with OANDA, and is intended for general circulation only. OANDA does not guarantee the accuracy of this information and assumes no responsibilities for the information provided by the third party. The information does not take into account the specific investment objectives, financial situation, or particular needs of any particular person. You should take into account your specific investment objectives, financial situation, and particular needs before making a commitment to trade, including seeking advice from an independent financial adviser regarding the suitability of the investment, under a separate engagement, as you deem fit.
You accept that you assume all risks in independently viewing the contents and selecting a chosen strategy.
Where the research is distributed in Singapore to a person who is not an Accredited Investor, Expert Investor or an Institutional Investor, Oanda Asia Pacific Pte Ltd (“OAP“) accepts legal responsibility for the contents of the report to such persons only to the extent required by law. Singapore customers should contact OAP at 6579 8289 for matters arising from, or in connection with, the information/research distributed.

short #fra40 around 7550 with minimum 200 pts target at 7350i wont say much stuff,but what i will say ,its full fundamental and what happens in the country
#cac40 (fra40 outperform many index,if its not all) while in France all gone bad since many weeks
Big protest and it is not finish..
next data will surely be down as protest had block few sector
the President public opinion had never been so low u can go on twitter every day in the best trend have aty least 2 tag for him and all are bad.
so i dunno but many gap still open far down
and at anytime i big drama protest can happens too
but technically have so much gap to fill

CAC40: some confluence?1. Declining Channel Pattern:
The most prominent feature on the chart is the declining channel pattern. Historically, when prices touch the lower trendline, we often witness a bounce.
2. Linear Regression Channel
There is also evidence of a linear regression channel pattern, with the price recently testing its lower range. This provides a potential area of interest for traders, as prices tend to revert to the mean after extreme deviations.
3. Fibonacci Retracement Levels:
The index is currently hovering near the 38.2% retracement level, considered the 'golden ratio' in technical analysis. A solid break or bounce from this level could provide insights into the index's future direction.
4. Target and Stop Levels:
A bullish target has been set at 7300, suggesting a potential upside of +2.8%. Conversely, a stop level is identified at 7000, translating to a potential downside risk of -1.5%. The win/loss ratio here stands at 1.6:1.
5. Key Note:
A note on the chart points out that the index is "Testing the lower range of the linear regression channel pattern, and counter-testing the declining channel pattern's trend." This observation is critical, as the convergence of these two patterns (confluence) at the current price level could serve as a strong inflection point.
Conclusion:
The CAC 40 Index is currently at an intriguing juncture. While the declining channel suggests bearishness, the linear regression channel's lower bound provides hope for a potential bounce. Combined with the current position near the 200-day simple moving average and the 38.2% Fibonacci level, traders should be on high alert for a price movement.
Remains a risky trade.
