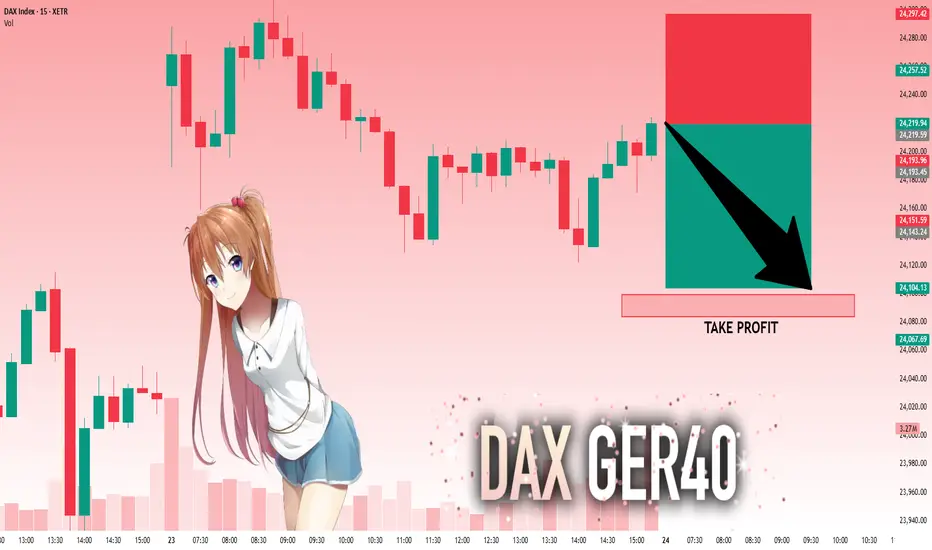
DAX Bearichthe complete set up shoxs that Dax is ranging inside the internal zone , creating a double top on the 4H time frame, witing for the smal trigger to short the position
GER30 trade ideas
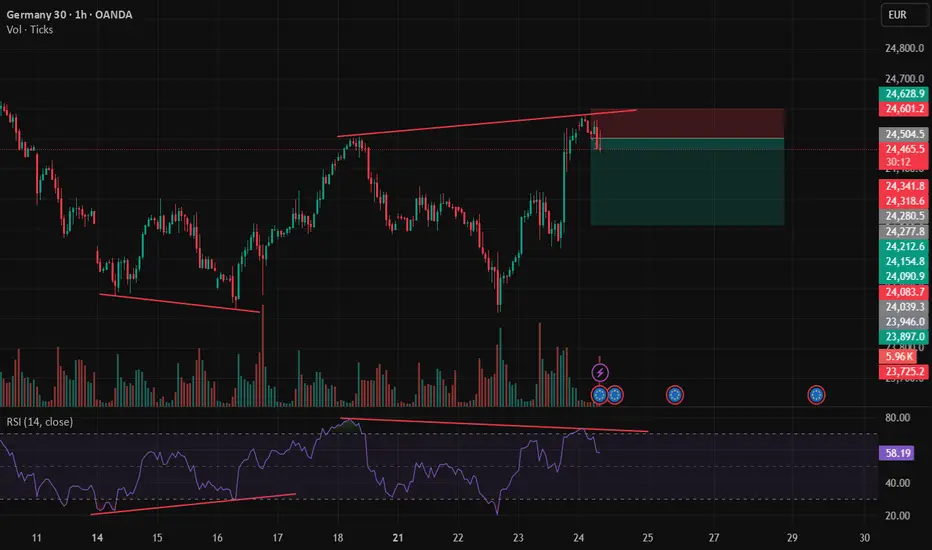
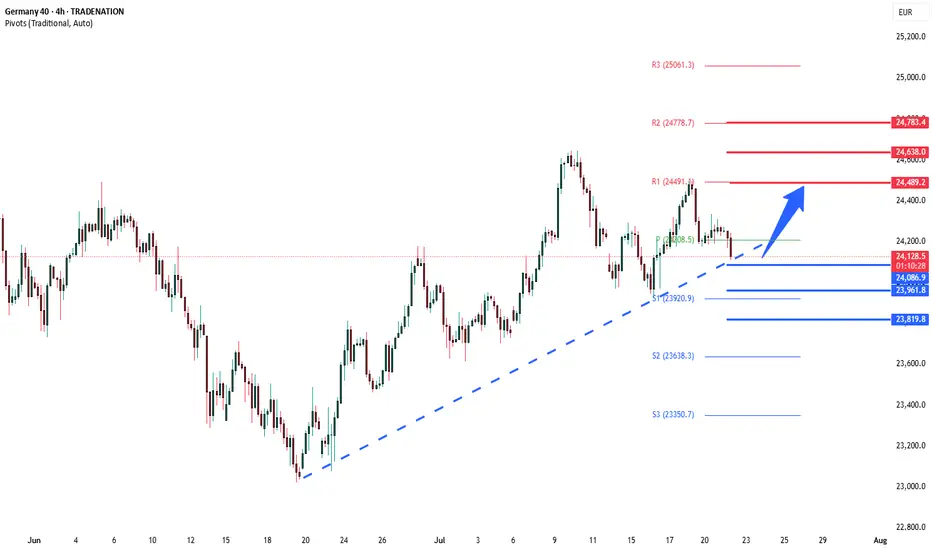
Trendline BreakThe price has broken a bullish trendline followed by a pullback and now the price looks to go short
WE ONLY TRADE PULLBACKS

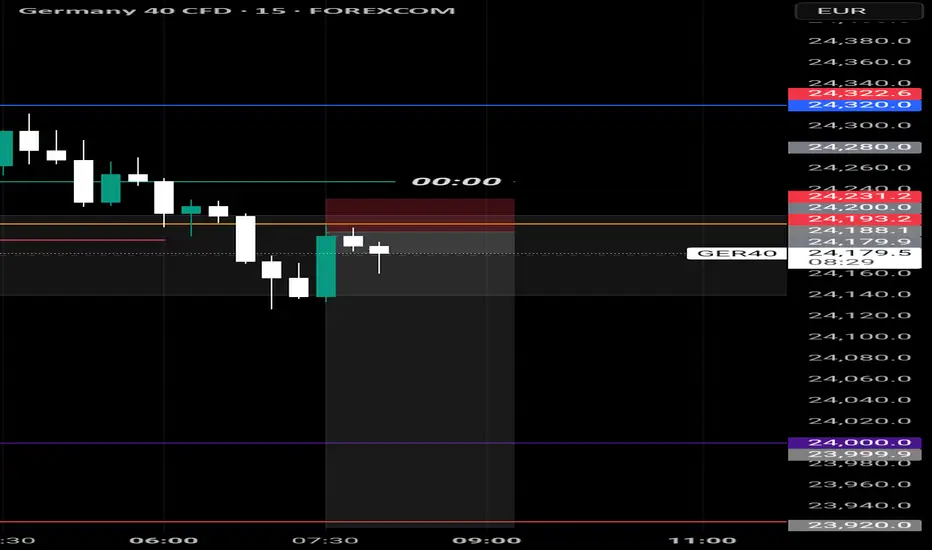
DAX: Target Is Down! Short!
My dear friends,
Today we will analyse DAX together☺️
The recent price action suggests a shift in mid-term momentum. A break below the current local range around 24,219.59 will confirm the new direction downwards with the target being the next key level of 24,099.27.and a reconvened placement of a stop-loss beyond the range.
❤️Sending you lots of Love and Hugs❤️
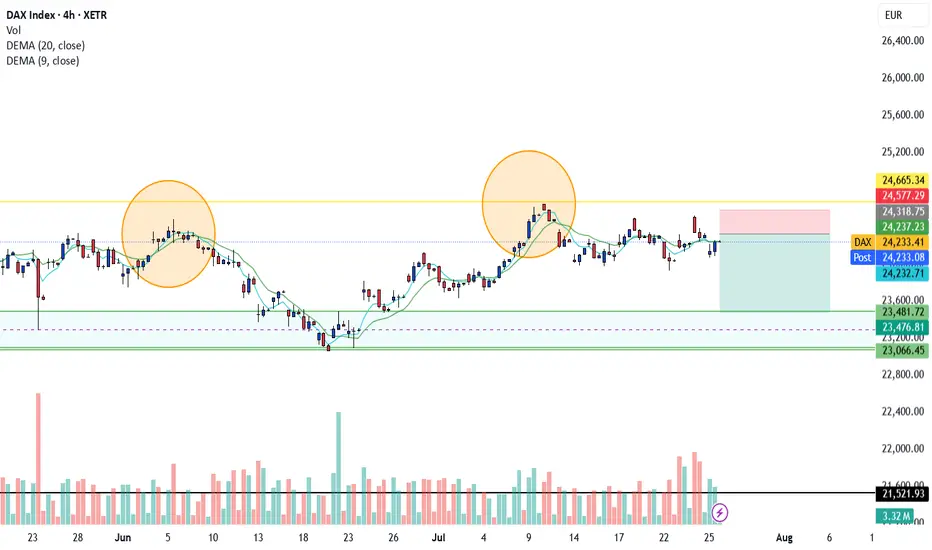
Double top Double top on the Dax with RSI regular divergency. If are feeling brave enough you could let this run all the way down to 24k.
GER40 SELLGER40 SELL
SL & TP as shown
Entry on 24180,24160,24120
Adjust your SL accordingly
Could be a scalp trade according to your taste
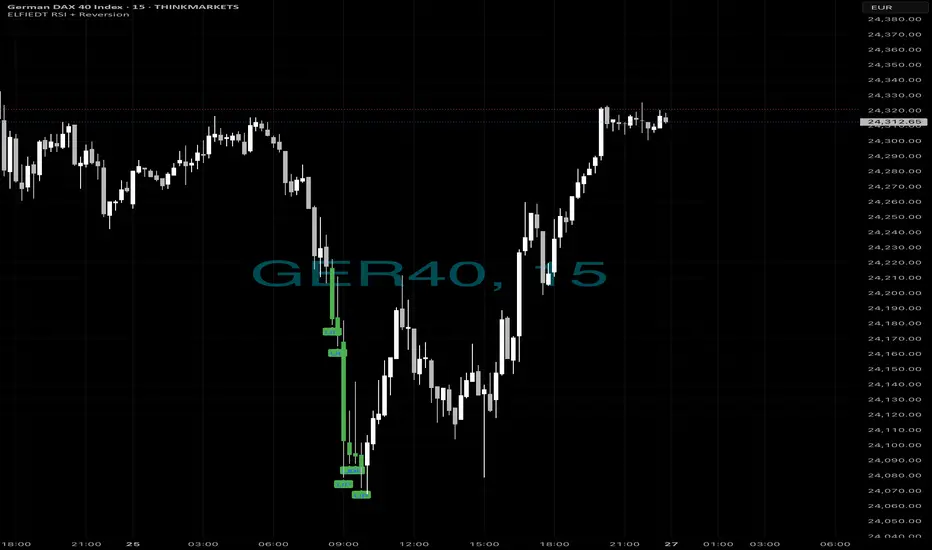
Same as always….📈 The Market Crashed. We Bought the Bottom. Again. 💥
Just another 15-minute chart… or is it?
While panic hit the DAX this morning, ELFIEDT RSI + Reversion was calmly printing BUY after BUY at the dead low. No guessing. No hype. Just precision.
✅ 5 Buy signals within minutes
✅ Picture-perfect mean reversion
✅ Price soared right after
✅ ZERO lag. ZERO repaint.
If you missed this move, don’t worry — this is what my system does.
🧠 Want to learn the logic behind this?
💰 Want to use it live on your own charts?
👉 Drop a 🔥 below if you want access.
👉 DM me “ELFIEDT” to test it out.
👉 Follow for real, repeatable setups.
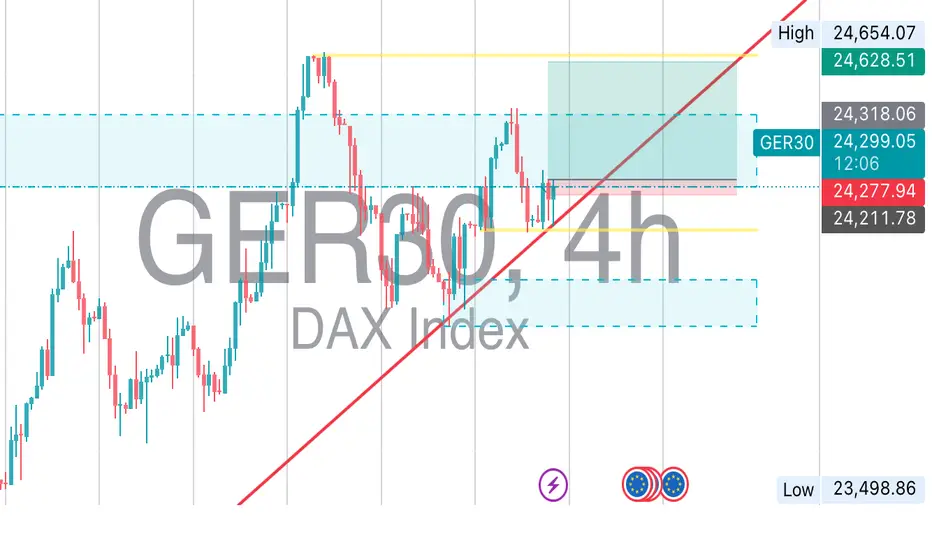
DAX40 Bullish breakout retest support at 24205The DAX remains in a bullish trend, with recent price action showing signs of a corrective pullback within the broader uptrend.
Support Zone: 24205 – a key level from previous consolidation. Price is currently testing or approaching this level.
A bullish rebound from 24205 would confirm ongoing upside momentum, with potential targets at:
24655 – initial resistance
24780 – psychological and structural level
25064 – extended resistance on the longer-term chart
Bearish Scenario:
A confirmed break and daily close below 24205 would weaken the bullish outlook and suggest deeper downside risk toward:
24100 – minor support
23921 – stronger support and potential demand zone
Outlook:
Bullish bias remains intact while the DAX40 holds above 24205. A sustained break below this level could shift momentum to the downside in the short term.
This communication is for informational purposes only and should not be viewed as any form of recommendation as to a particular course of action or as investment advice. It is not intended as an offer or solicitation for the purchase or sale of any financial instrument or as an official confirmation of any transaction. Opinions, estimates and assumptions expressed herein are made as of the date of this communication and are subject to change without notice. This communication has been prepared based upon information, including market prices, data and other information, believed to be reliable; however, Trade Nation does not warrant its completeness or accuracy. All market prices and market data contained in or attached to this communication are indicative and subject to change without notice.

DAX / DE30 Long Day TradeXETR:DAX / ICMARKETS:DE30 taking a pullback towards up, catching this pullback.
These are good levels if you trade nicely.
Use proper risk management
Looks like good trade.
Lets monitor.
Use proper risk management.
Disclaimer: only idea, not advice

The Kiss of Death Trade & Other Reasons for EntryFollowing up on the 2618 opportunity that we looked at on the FOREXCOM:GER40 this past weekend the market has now created more potential trading opportunities to get involved.
1) A bullish bat pattern that has completed due to a result of a complex pullback into the original double bottom.
2) A potential Kiss of Death trading opportunity
3) A bigger potential bullish gartley pattern IF the current 2618 opportunity is violated.
Please leave any questions or comments below & feel free to share your opinion on the setup.
Akil

Ger30 on bullish Ger30 indicates a strong continuation of an uptrend on different timeframe , and the bullish bar on the support on H4 evident enough to start looking for an entry rn
DAX40 Support retest at 24085The DAX remains in a bullish trend, with recent price action showing signs of a resistance breakout within the broader uptrend.
Support Zone: 24085 – a key level from previous consolidation. Price is currently testing or approaching this level.
A bullish rebound from 24085 would confirm ongoing upside momentum, with potential targets at:
24490 – initial resistance
24640 – psychological and structural level
24780 – extended resistance on the longer-term chart
Bearish Scenario:
A confirmed break and daily close below 24085 would weaken the bullish outlook and suggest deeper downside risk toward:
23970 – minor support
23800 – stronger support and potential demand zone
Outlook:
Bullish bias remains intact while the DAX holds above 24085. A sustained break below this level could shift momentum to the downside in the short term.
This communication is for informational purposes only and should not be viewed as any form of recommendation as to a particular course of action or as investment advice. It is not intended as an offer or solicitation for the purchase or sale of any financial instrument or as an official confirmation of any transaction. Opinions, estimates and assumptions expressed herein are made as of the date of this communication and are subject to change without notice. This communication has been prepared based upon information, including market prices, data and other information, believed to be reliable; however, Trade Nation does not warrant its completeness or accuracy. All market prices and market data contained in or attached to this communication are indicative and subject to change without notice.
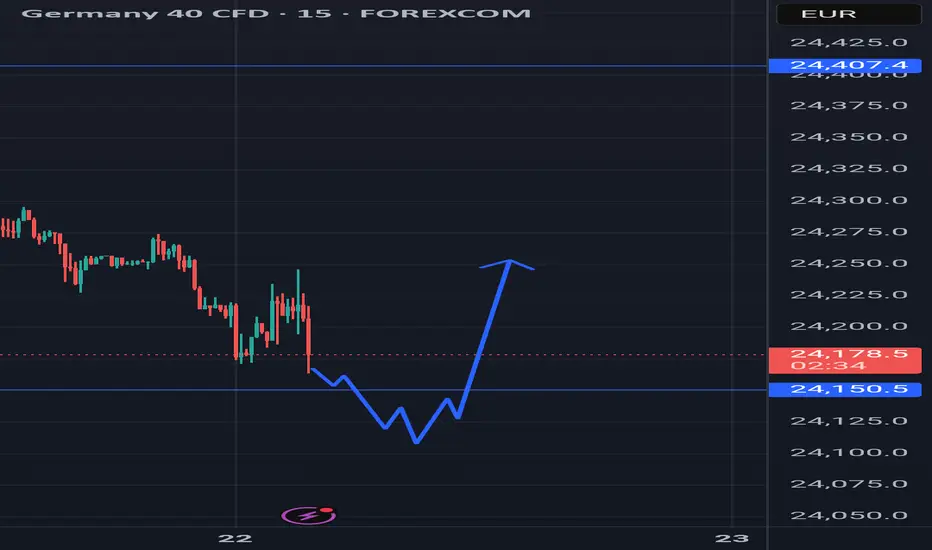
Intraday Pullback Understanding the higher timeframe is going to make a run for liquidity,
Intraday it will need to try to take out the shorters of last week.
Expecting a long on the 5m and the 15m towards Poi
Trade the plan & Plan the trade!
Trojan Trading Academy

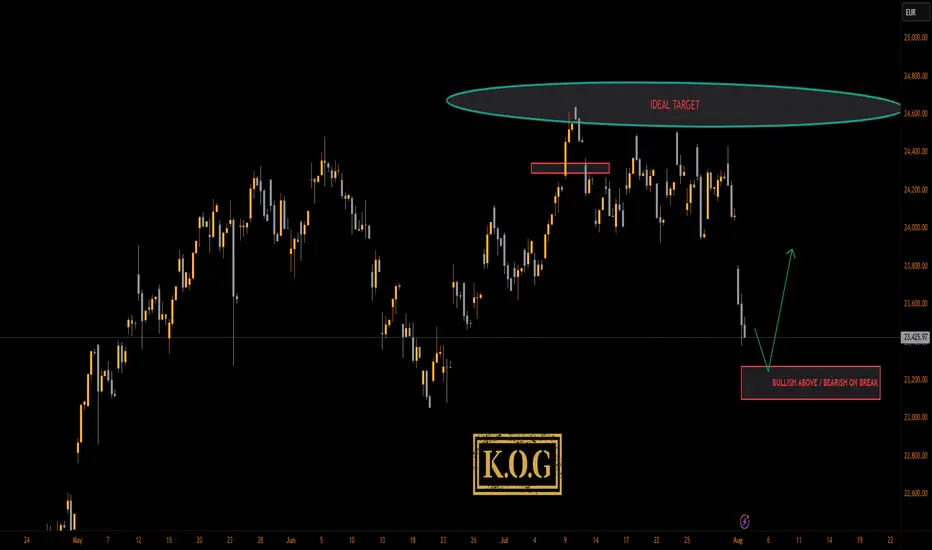
KOG - DAXWe hit the target nicely on this and then got the reversal trade we wanted which gave our traders and extra bonus.
Now, we have key level below and a RED BOX lining up, if attempted, we may just test that level for a long on the retracement.
As always, trade safe.
KOG
#DAXDate: 01-08-2025
#DAX Current Price: 23680
Pivot Point: 24193.295 Support: 23822.409 Resistance:24566.692
Upside Targets:
🎯 Target 1: 24882.344
🎯 Target 2: 25197.995
🎯 Target 3: 25574.758
🎯 Target 4: 25951.520
Downside Targets:
🎯 Target 1: 23505.502
🎯 Target 2: 23188.595
🎯 Target 3: 22811.833
🎯 Target 4: 22435.070
#TradingView #Nifty #BankNifty #DJI #NDQ #SENSEX #DAX #USOIL #GOLD #SILVER
#BHEL #HUDCO #LT #LTF #ABB #DIXON #SIEMENS #BALKRISIND #MRF #DIVISLAB
#MARUTI #HAL #SHREECEM #JSWSTEEL #MPHASIS #NATIONALUM #BALRAMCHIN #TRIVENI
#USDINR #EURUSD #USDJPY
#SOLANA #ETHEREUM #BTCUSD #MATICUSDT #XRPUSDT
#Crypto #Bitcoin #BTC #CryptoTA #TradingView #PivotPoints #SupportResistance

Germany 40DE40 Looks like doing this. It's going to retest an old area that was used bypassed while making an all time high.

GER40 ATH LOADINGIt as not been an easy week for the market. But we move, here on these post, i made analysis on EIGHTCAP:GER40 , Using the combination of dailytf, H4 and H2, For further clarification, pls see the video. All the best.


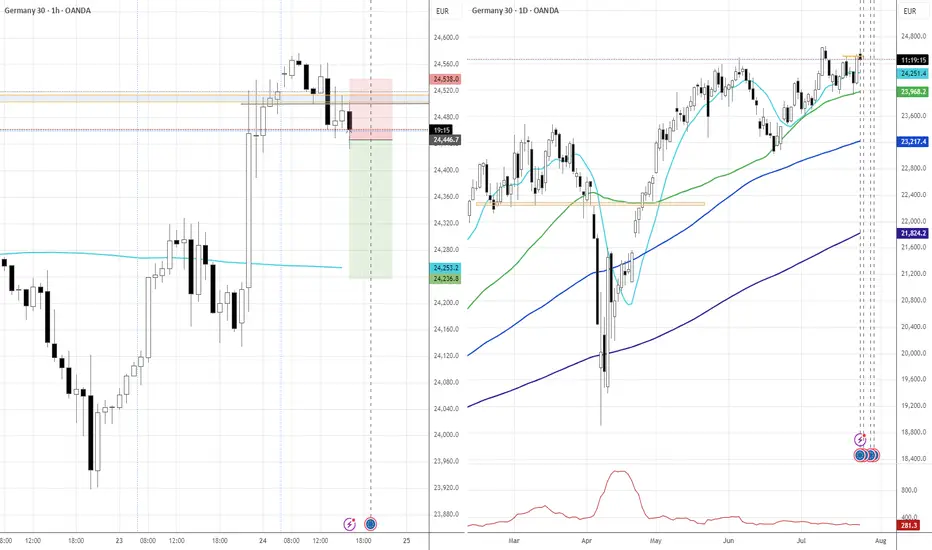
DAX - potential buyPotential buy on the German index as we are coming out of the 30min correction that followed a first small impulse to the upside. Conservative target is a move equivalent to the first 30 min setup. Optimal target are the break of the top and even better the 24.85 area. Levels on the chart. Trade with care.

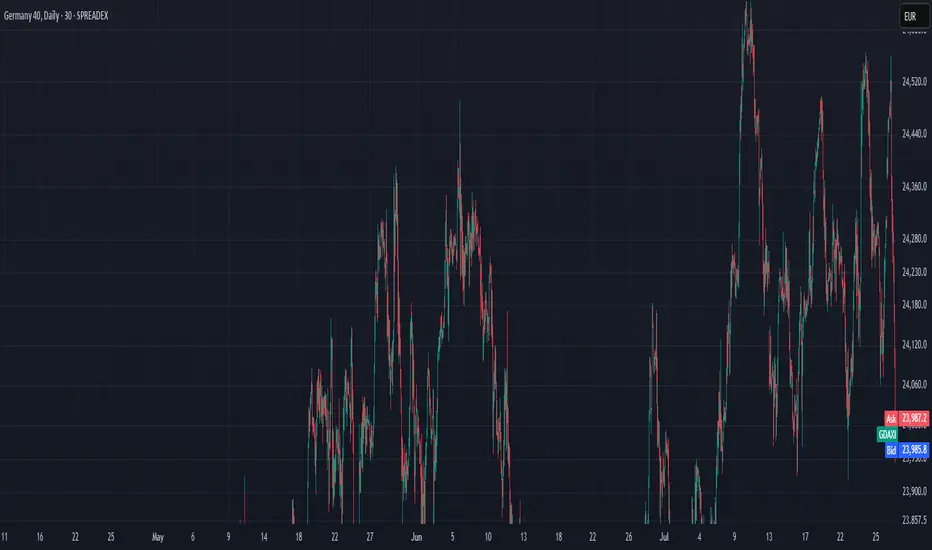
DAX 24.07.2025~+ Post-trade deal risk-on seems to be subsiding
~+ Profit taking towards the ECB Rate decision
Technical Analysis WeeklyGermany 40 remains in a bullish trend and is currently in a pullback phase. It trades at 24,308, almost identical to its VWAP of 24,307.5. The RSI at 54 suggests a pause in momentum. Support is found at 23,786 and resistance at 24,650.
UK 100 is in an impulsive bullish phase, breaking above previous highs with price at 9,145 well above the VWAP at 8,970. The RSI is at 73, indicating strong buying pressure. Support is at 8,748 and resistance is at 9,101.
Wall Street continues its bullish trend, pausing near recent highs. The price is at 44,880, above its VWAP of 44,445. RSI at 63 confirms steady bullish momentum. Support sits at 43,921 and resistance at 44,880.
Brent Crude remains in a broad neutral trend with short-term range-bound action. Price is at 6,768, just under VWAP of 6,866. RSI at 45 reflects a lack of directional conviction. Support is at 6,717 and resistance at 7,015.
Gold continues to trade sideways within a broad range. It trades at 3,337, nearly equal to its VWAP. The RSI at 47 suggests balance. Support is found at 3,290 and resistance at 3,407.
EUR/USD holds a bullish trend while undergoing a correction. It trades at 1.1740, close to its VWAP at 1.1699. The RSI at 59 shows mild positive momentum. Support is at 1.1585 and resistance at 1.1814.
GBP/USD is in a bullish trend but under corrective pressure and seemingly turning rangebound. The price is 1.3433, slightly below the VWAP of 1.3511. RSI is at 42, hinting at waning momentum. Support is 1.3336, resistance at 1.3687.
USD/JPY continues in a neutral trend but could be about to break higher, currently ranging around 147.66 and VWAP at 147.00. RSI at 57 shows a modest bullish bias after having pulled back from overbought territory. Support is at 144.54 and resistance at 149.46.
GER40 | Cools Below ResistanceThe DAX rallied aggressively into 24,618.3, but price action has since turned sideways. The index is now ranging just below resistance, as bulls and bears battle for direction in this consolidation phase.
Support at: 24,000.00 / 23,687.21 / 23,500.00 / 23,047.01 🔽
Resistance at: 24,618.30 🔼
🔎 Bias:
🔼 Bullish: Clean break and close above 24,618.30 targets fresh highs.
🔽 Bearish: Break below 24,000 may confirm short-term distribution toward 23,687 and 23,500.
📛 Disclaimer: This is not financial advice. Trade at your own risk.

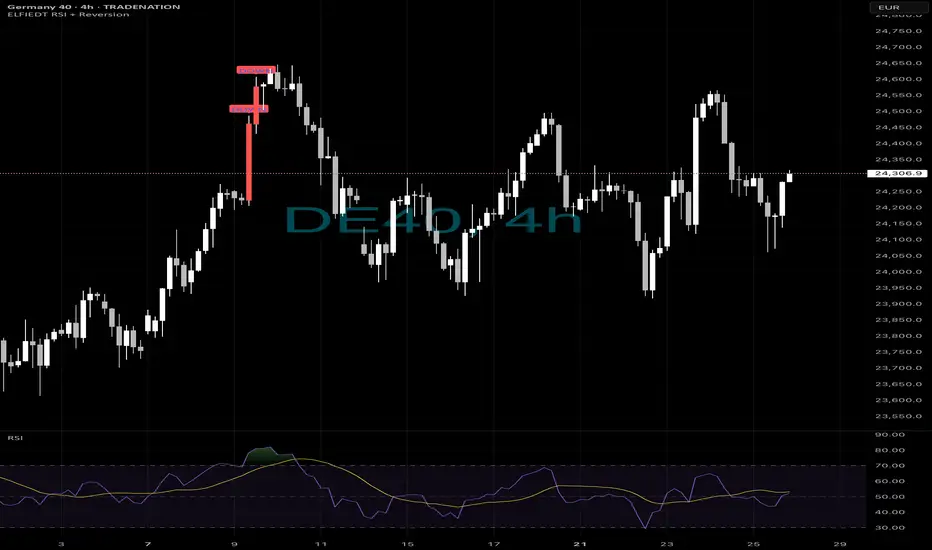
Long or short?📉 Everyone Bought the Dip… You Could’ve Sold the Top.
While most traders chased short-term bounces,
the ELFIEDT RSI + Reversion script called SHORT on the 4H — right at the peak.
🔻 Double confirmation:
1. Reversion SELL trigger
2. Bearish RSI divergence
Result? A massive unwind.
⸻
Why Swing Traders Win:
⚠️ Lower timeframes were printing BUYs inside this structure…
But smart money knows:
🧠 4H structure > 15m noise
This is the power of top-down confluence:
Trust the higher timeframe → avoid false longs → ride the move with confidence.
⸻
📍 ENTRY STRATEGY:
1. Watch 4H RSI diverge from price
2. Wait for ELFIEDT “DOWN” tag confirmation
3. Enter short on next candle break
4. SL = above signal high
5. Let the cascade unfold
This is how you avoid the trap — and catch the trend early.
⸻
💬 DM “DAX 4H SHORT” for the full system
📈 Follow for high-timeframe precision setups
🔒 No noise. No hype. Just structure + signals that deliver