The "True Close" Institutions Don't Talk About — But Trade On█ My Story from the Inside
I worked at a hedge fund in Europe, where I served as a Risk Advisor. One thing I never expected before joining the institutional side of the market was this:
They didn’t treat the current day’s close as the "true" close of the market.
Instead, they looked at the first hour of the next day — once all pending flows had settled, rebalancing was done, and execution dust had cleared — that was the true close in their eyes.
Here’s why that changed everything I knew about trading:
█ Institutional Reality vs Retail Fantasy
⚪ Retail traders are taught:
“The daily close is the most important price of the day.” But institutions operate under constraints that most retail traders are never exposed to:
Orders too large to fill before the bell
Internal compliance and execution delays
Batch algorithms and VWAP/TWAP systems that extend into the next session
So while the market might close on paper at 17:30 CET, the real trading — the stuff that matters to funds — might not wrap up until 09:30 or 10:00 the next morning.
Although the official “close” prints here, institutional volume ends quickly. It drops off sharply, almost immediately. Once the books are closed and final prints are done, big players exit — and what's left is thin, passive flow or noise.
The first hour of the New York session reveals structured flows, not random volatility. This is where institutions finalize yesterday’s unfinished business, which is why many consider this the “true” close.
And that’s the price risk managers, portfolio managers, and execution teams internally treat as the reference point.
█ Example: The Rebalance Spillover
Let’s say a fund needs to offload €100 million worth of tech stocks before month-end. They start into the close, but liquidity is thin. Slippage mounts. They pause execution. Next morning, their algo resumes — quietly but aggressively — in the first 30 minutes of trade.
You see a sharp spike. Then a reversal. Then another surge.
That’s not noise. That’s structure. It’s the result of unfinished business from yesterday.
█ Why the First Hour is a War Zone
You’ve probably seen it:
Prices whip back and forth at the open
Yesterday’s key levels are revisited, sometimes violently
Big moves happen without any overnight news
Here’s what’s happening under the hood:
Rebalancing spillovers from the day before
Late-position adjustments from inflows/outflows
Risk parity or vol-targeting models triggering trades based on overnight data
The market’s not reacting to fresh news — it’s completing its old to-do list.
█ What the Research Really Says About Morning Volatility
The idea that "the true close happens the next morning" isn’t just insider intuition — it’s backed by market microstructure research that highlights how institutional behaviors disrupt the clean narrative of the official close.
Here’s what the literature reveals:
█ Heston, Korajczyk & Sadka (2010)
Their study on intraday return patterns shows that returns continue at predictable 30-minute intervals, especially around the open.
The key driver? Institutional order flow imbalances.
When big funds can’t complete trades at the close, they spill into the next session, creating mechanical, non-informational momentum during the first hour. These delayed executions are visible as persistent price drifts after the open, not random volatility.
█ Wei Li & Steven Wang (SSRN 2010)
This paper dives into the asymmetric impact of institutional trades. It shows that when institutions are forced to adjust positions — often due to risk limits, inflows/outflows, or model-based triggers — the market reacts most violently in the early hours of the day.
When funds lag behind the clock, the next morning becomes a catch-up window, and price volatility spikes accordingly.
█ Lars Nordén (Doctoral Thesis, Swedish Stock Exchange)
In his microstructure research, Nordén found that the variance of returns is highest in the early part of the session, not at the close. This is especially true on days following macro events or at the end/start of reporting periods.
The data implies that institutions “price in” what they couldn’t execute the day before, making the next morning more informative than the actual close.
█ Bottom Line from the Research:
The first hour isn’t wild because it’s full of emotion.
It’s wild because it’s full of unfinished business.
These studies reinforce that price discovery is a rolling process, and for institutional flows, the official close is just a checkpoint, not a final destination.
█ How to Use This as a Trader
⚪ Don't assume the official close is final
Treat it as a temporary bookmark. Watch what happens in the first hour of the next day — that’s when intentions are revealed.
⚪ Volume in the first 30–60 minutes matters
It’s not noise — it’s flow completion. Often non-price-sensitive. Often mechanical.
⚪ Design strategies around “true close” logic
Test fade setups after the first hour’s range is established. That’s often the real “settled” level.
⚪ Use the first-hour VWAP or midpoint as a reference
Institutions may anchor to that — not the official close — for mean reversion or risk metrics.
█ Final Thought
The first hour is not the start of something new.
It’s the conclusion of yesterday’s market.
And unless you understand how institutions truly close their books — and how long that takes — you’ll always be a step behind.
So next time you see chaos at the open, stop calling it random.
👉 It’s just the market putting yesterday to bed — late.
-----------------
Disclaimer
The content provided in my scripts, indicators, ideas, algorithms, and systems is for educational and informational purposes only. It does not constitute financial advice, investment recommendations, or a solicitation to buy or sell any financial instruments. I will not accept liability for any loss or damage, including without limitation any loss of profit, which may arise directly or indirectly from the use of or reliance on such information.
All investments involve risk, and the past performance of a security, industry, sector, market, financial product, trading strategy, backtest, or individual's trading does not guarantee future results or returns. Investors are fully responsible for any investment decisions they make. Such decisions should be based solely on an evaluation of their financial circumstances, investment objectives, risk tolerance, and liquidity needs.
NAS100 trade ideas

NASDAQ Close to the 1st 1D Golden Cross in 2 years!Nasdaq (NDX) has been trading within a Channel Up since the December 2022 Low and is currently extending the gains of the latest Bullish Leg.
At the same time it is about to form the first 1D Golden Cross in more than 2 years (since March 08 2023). The last two major Bullish Legs of this pattern, before the previous one was interrupted by the Trade War, were pretty symmetrical, peaking at +49.21% and +47.47% respectively.
If the current one follows the +47.47% 'minimum', we should be expecting Nasdaq to hit 24000 by late Q3.
-------------------------------------------------------------------------------
** Please LIKE 👍, FOLLOW ✅, SHARE 🙌 and COMMENT ✍ if you enjoy this idea! Also share your ideas and charts in the comments section below! This is best way to keep it relevant, support us, keep the content here free and allow the idea to reach as many people as possible. **
-------------------------------------------------------------------------------
Disclosure: I am part of Trade Nation's Influencer program and receive a monthly fee for using their TradingView charts in my analysis.
💸💸💸💸💸💸
👇 👇 👇 👇 👇 👇

USTECH Long Opportunity USTECH is currently on a break out to the upside, resuming the bullish trend. Price broke out above $21820 and is currently on a retracement where it could potentially provide a break and retest level at $21820.
Price is trading above the 50 SMA and is currently showing bullish momentum coming out of the RSI.
There is bullish structure amidst the consolidation present thus its important to trade cautious. Looking to the ride the bullish wave from the $21820 to the resistance at $22050.

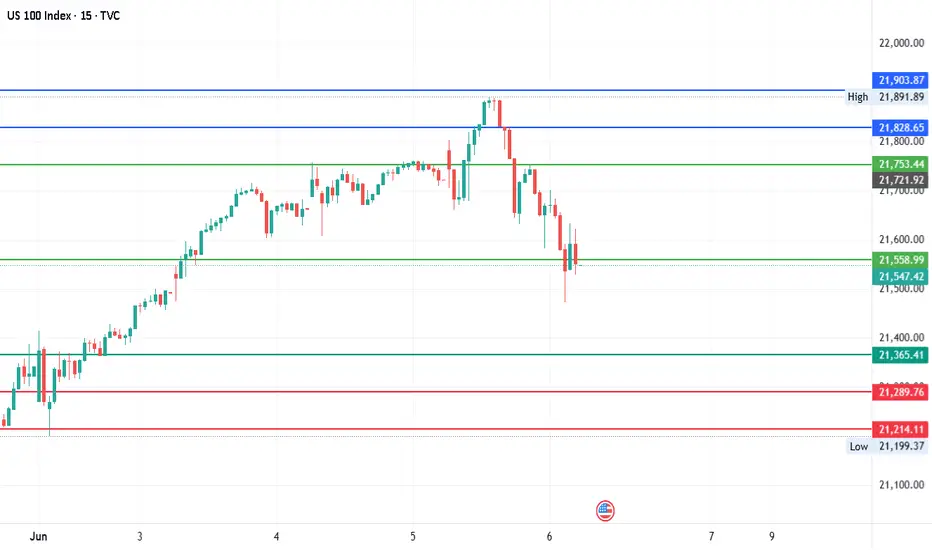
#NDQ - Daily | Pivot is 21547.43 Date: 06-06-2025
#NDQ Current Price: 21547.43
Pivot Point: 21558.99 Support: 21365.41 Resistance: 21753.44
Upside Targets:
Target 1: 21828.65
Target 2: 21903.87
Target 3: 22033.20
Downside Targets:
Target 1: 21289.76
Target 2: 21214.11
Target 3: 21084.78
Nasdaq Challenges Record HighsNasdaq continues to trade just below a one-month resistance line, which connects consecutive higher highs formed between May and June 2025. This line has capped the index just shy of the 22,000 mark, as price action navigates the push and pull between summer momentum, geopolitical tensions, and economic uncertainty.
To the upside, a decisive break and hold above 22,200 would be a bullish trigger, potentially opening the path toward the 23,700 resistance zone. This level notably aligns with the 0.618 Fibonacci extension, projected from the 2023 low, 2025 high, and 2025 retracement low.
On the downside, risks remain for a deeper correction if the index retraces toward the 21,000–20,600 region. This zone represents the neckline of the December–January double top, and stands as a critical threshold separating a bullish continuation scenario from the possibility of a deeper bearish pullback.
- Razan Hilal, CMT

Hanzo / Nas100 30 Min ( Accurate Tactical Break Out Zones )🔥 Nas100 – 30 Min Scalping Analysis (Bearish Setup)
⚡️ Objective: Precision Breakout Execution
Time Frame: 30-Minute Warfare
Entry Mode: Only after verified breakout — no emotion, no gamble.
👌Bullish After Break : 21810
Price must break liquidity with high volume to confirm the move.
👌Bearish After Break : 21640
Price must break liquidity with high volume to confirm the move.
☄️ Hanzo Protocol: Dual-Direction Entry Intel
➕ Zone Activated: Strategic liquidity layer detected — mapped through refined supply/demand mechanics. Volatility now rising. This isn’t noise — this is bait for the untrained. We're not them.
🩸 Momentum Signature Detected:
Displacement candle confirms directional intent — AI pattern scan active.
— If upward: Bullish momentum burst.
— If downward: Aggressive bearish rejection.
🦸♂️ Tactical Note:
The kill shot only comes after the trap is exposed and volume betrays their position.

NASDAQ Weekly Trading Strategy: Bullish Opportunities Amid Secto- Current Price: 21631.04
- Key Insights:
- NASDAQ’s mixed performance suggests an ideal opportunity for selective
trading, with robust long-term bullish trends juxtaposed against short-term
volatility.
- Traders should focus on support levels for entry and utilize resistance
targets for profit-taking. Technology stocks exhibit vulnerabilities but may
rebound if key supports hold. Tesla's relative strength over peers offers
additional momentum within the sector.
- Price Targets:
- Next Week Targets:
- T1: 22,000
- T2: 22,600
- Stop Levels:
- S1: 21,200
- S2: 20,800
- Recent Performance:
- The NASDAQ saw a -0.63% decline last week, performing better than the Dow
(-1.32%) but lagging behind the S&P 500 (-0.39%). Technology sector divergence
dominated trading, with weakness in Nvidia and Apple contrasting Tesla’s
resilience.
- Expert Analysis:
- Despite short-term challenges, investor sentiment remains optimistic based
on institutional data, provided that support levels hold firm. NASDAQ’s position
above crucial long-term moving averages suggests sustained bullish interest.
However, short-term signals warn of possible pullbacks due to broader risk
aversion.
- News Impact:
- Escalating geopolitical tensions in the Middle East contributed to increased
market volatility. Risk-off sentiment pushed investors toward safer assets like
gold and oil, impacting equity flows. As tensions persist, the market may face
heightened challenges next week.

NAS100 live trade execution 10k profit and breakdown Seven fundamentals for the week: Iran-Israel war, Fed to fire up tariff-troubled markets
Premium
When will the Fed cut interest rates? That question competes with the Israel-Iran war and the fate of the tariffs America slaps on its peers. US retail sales and interest rate decisions in Japan and the UK keep things lively as well.

US100 – Eyes on $22,040 as bulls take chargeIntroduction
The US100 is currently showing signs of a bullish breakout, moving above the boundaries of a previously established parallel channel. It is now approaching an important area of imbalance, known as a Fair Value Gap (FVG), on the 4-hour chart. If the index manages to break through this zone, there is a strong potential for continued upward momentum. Let’s take a closer look at the technical setup and what might come next.
Parallel Channel
For some time, the US100 had been trading within a downward-sloping parallel channel, consistently making lower highs and lower lows. However, today's price action has changed that narrative. The index has broken out of the channel to the upside and is currently pushing towards new short-term highs, which could mark the beginning of a bullish trend reversal.
4-Hour Fair Value Gap (FVG)
The current focus is on an open 4-hour FVG that ranges from approximately 21,840 to 21,870. This zone could serve as a significant resistance level, potentially rejecting further upward movement. However, if the US100 breaks decisively above this range, it could open the door for a rapid push toward previous highs. Such a move would signal strong bullish momentum and confirm the breakout as legitimate.
Possibility of a False Breakout
There is always the risk that this breakout could turn out to be a false move. If the US100 fails to hold above the 4-hour FVG and reverses back below the channel breakout point, it could indicate a bull trap. In that case, the index may resume its downward trend. Still, based on the current momentum and market structure, this scenario seems less likely at the moment.
Upside Target
If the breakout above the FVG is successful, the next significant target lies at the recent highs near 22,040. This level is expected to act as strong resistance. Should the US100 manage to break through it, we could see a test of the all-time high in the near future. However, it’s important to approach the market with patience and let each level confirm itself before expecting further upside.
Conclusion
While the US100 has successfully broken out of its parallel channel, it is now facing a key test at the 4-hour FVG. A clean break above this zone would likely shift market sentiment to bullish and set the stage for a move toward 22,040 and potentially beyond. Until then, traders should watch closely for confirmation and be mindful of the possibility of a pullback.
Disclosure: I am part of Trade Nation's Influencer program and receive a monthly fee for using their TradingView charts in my analysis.
Thanks for your support.
- Make sure to follow me so you don't miss out on the next analysis!
- Drop a like and leave a comment!

BUYToday looking for Nas to push to the upside bullish trend am expecting a pullback to than look for possible entries or price can keep pushing would get in on lower timeframe

Sell on Nas100We are heading for the Friday settlement price, being the 1614hrs candle then Weekly opening gap

Sells On Nas100 We are heading for the Friday settlement price, being the 1614hrs candle then Weekly opening gap

USNAS100 -Risk-Off Sentiment Keeps USNAS100 in Bearish TerritoryUSNAS100 – Bearish Momentum Holds as Traders Watch Geopolitical Risks and Fed Signals
The NASDAQ (USNAS100) remains under pressure as market sentiment stays cautious amid ongoing Middle East tensions and uncertainty ahead of this week’s Federal Reserve outlook. While the geopolitical escalation has not triggered panic, it continues to weigh on risk appetite—particularly in tech-heavy indices.
Technical Outlook:
The price currently appears to be heading toward 21635. A 1H close below this level is expected to confirm further downside toward 21470.
A break below the key support zone could open the door to the next bearish leg targeting 21065.
To shift the structure to bullish, the price would need a confirmed 4H candle close above the 21790–21850 resistance zone.
Key Levels:
• Support: 21635, 21470, 21375
• Resistance: 21930, 22090, 22200

NASDAQ Analysis: Navigating Uncertainty in a Shifting LandscapeThe NASDAQ has been on a rollercoaster ride lately 🎢, reflecting both global macro shifts and sector-specific dynamics. After dipping into bear market territory earlier in the year, the index has rebounded strongly, powered by mega-cap tech and the ongoing AI boom 🤖. However, the mood remains cautious as investors weigh political and economic cross-currents. Note how price action is stalling at the current level.
Fundamentals & Earnings 💼
Earnings Resilience: Q1 2025 earnings for NASDAQ heavyweights were robust, with tech giants posting double-digit growth. Yet, forward guidance is more muted, as companies brace for the impact of higher tariffs and global supply chain adjustments.
Valuations: The recent rally has pushed forward P/E ratios well above long-term averages, making the market more sensitive to any negative surprises 📈.
AI & Innovation: Capital expenditure on AI is set to exceed$300 billion this year, keeping the sector in the spotlight and fueling optimism for long-term growth.
Political & Geopolitical Factors 🌍
Trade Policy: The U.S. and China have agreed to a temporary pause on new tariffs, easing some immediate concerns. However, the average effective tariff rate remains much higher than last year, and uncertainty lingers as legal challenges and further negotiations loom.
Fiscal Policy: U.S. deficit worries are back in focus, with new legislation projected to add trillions to the national debt over the next decade. This has contributed to higher Treasury yields and a weaker dollar 💵.
Global Competition: International equities have outperformed U.S. stocks over the past six months, but history suggests this may be stretched, and a reversal could be on the horizon.
Market Sentiment & Technicals 📊
Volatility: While volatility has eased from its spring highs, sentiment remains fragile. Consumer and business confidence indices are at multi-year lows, even as hard economic data (like jobless claims) remains resilient.
Sector Rotation: Growth and cyclical sectors—especially tech, consumer discretionary, and industrials—have led the rebound, but investors are increasingly selective, favoring companies with strong fundamentals and global reach.
Outlook: The NASDAQ is cautiously optimistic for the second half of 2025. The market is pricing in a couple of Fed rate cuts by year-end, but the path forward depends on inflation trends, trade clarity, and corporate earnings.
Key Takeaways 🚦
The NASDAQ is in recovery mode, but faces headwinds from trade policy, fiscal uncertainty, and stretched valuations.
Political developments—especially around tariffs and fiscal policy—will be key drivers of volatility.
Long-term, the AI and tech innovation wave remains a powerful tailwind, but near-term caution is warranted.
Disclaimer:
This analysis is for informational purposes only and does not constitute investment advice. Markets are volatile and subject to rapid change. Always do your own research and consult a financial advisor before making investment decisions.

NAS100 - Priming to SHORTDear Friends in Trading,
How I see it,
Rising Wedge - Bullish Exhaustion Pattern
"SHORT" Targets:
1] 20740.00
2] 20200.00
Fundamentally:
If I was an institutional Invester and/or hedge fund manager with
100's of millions in US stocks. Considering the geopolitical tensions at the moment.
I will move the largest percentage of my portfolio to safe
haven $-bonds and/or commodities like GOLD.
But that's just me...
I sincerely hope my point of view offers a valued insight.
Thank you for taking the time to study my analysis.

NAS100 - Stock market awaits an important week!The index is above the EMA200 and EMA50 on the 4-hour timeframe and is trading in the specified pattern. If it does not rise again above the broken trend line, I expect a correction.
If the index returns above the broken trend line, we can expect a new ATH to be recorded on the Nasdaq. It is better to wait for confirmation on the breakout in order to control further risk.
Last week, U.S. stock markets—particularly the Nasdaq index—experienced significant volatility, driven by a combination of economic and geopolitical factors:
• A reduction in trade tensions due to ongoing U.S.-China negotiations
• The release of inflation indicators
• Heightened geopolitical tensions
According to Politico, as G7 leaders meet in Canada, the escalating conflict between Israel and Iran will top the agenda. Politico reported that leaders of the free world have gathered in the Rocky Mountains to discuss the very real threat of a full-scale war in the Middle East. The initial sessions of the G7 summit will take place in Kananaskis, where the worsening Israel-Iran conflict will be the primary focus. Donald Trump, who in recent days has fueled tensions through social media, is now expected to join discussions aimed at de-escalation.
On the economic front, lower-than-expected inflation in May could encourage the Federal Reserve to cut interest rates sooner than markets had previously anticipated. On Wednesday, the Bureau of Labor Statistics reported that inflation rose 2.4% in May compared to a year earlier. Housing costs were identified as the primary driver of this inflation, while price increases in categories most affected by high tariffs were not as pronounced as economists had expected. So far this year, the Fed has refrained from cutting its benchmark interest rate, citing concerns that tariffs might push consumer prices higher. While the likelihood of a rate cut at this week’s meeting remains low, the latest report could ease some of these worries and accelerate the timeline for potential cuts.
Meanwhile, Bloomberg reported that a growing group of President Trump’s advisers is urging him to consider Besant for the Fed chair position. Jerome Powell’s current term extends until May 2026, and he was originally nominated by Trump in November 2017. Other names reportedly under consideration include Kevin Warsh (considered a favored candidate), Kevin Hassett (head of the White House National Economic Council), Christopher Waller (a current Fed board member), and David Malpass (former World Bank president).
After a week dominated by U.S. inflation data, investor attention in the coming days will shift toward central bank decisions and potential signals regarding the future path of interest rates. The trading week kicks off Monday with the Empire State Manufacturing Index, offering an initial snapshot of the industrial sector in New York. Later that day, the Bank of Japan will announce its first interest rate decision, an event that could shape Asian market trends and the yen’s valuation.
On Tuesday, May’s U.S. retail sales data will be released—a key indicator of consumer strength. Signs of weakness in this report could bolster expectations for rate cuts. Wednesday will be the focal point of the week, as the Federal Reserve announces its policy decision. While markets have already priced in a pause in tightening, investors will scrutinize Jerome Powell’s remarks for clues on the likelihood of rate cuts in the months ahead. Additionally, data on May housing starts and weekly jobless claims will also be released that day.
On Thursday, with U.S. markets closed for Juneteenth, attention will turn to monetary policy decisions from the Swiss National Bank and the Bank of England. Changes in tone or interest rates from these key European central banks could influence currency market volatility. Finally, the week will conclude Friday with the release of the Philadelphia Fed Manufacturing Index—a leading indicator closely watched by traders for insights into the health of the manufacturing sector in the U.S. East.

Sell US100 Now US 100 made the equal highs and wait till reach the OB and rejection confirmed then can sell the SL is above the OB and the TP is 21690 and second TP is 21660

US100Correlation Between US100 (Nasdaq 100), 10-Year Bond Yield, and Bond Prices
1. Relationship Between 10-Year Treasury Bond Yield and Bond Prices
Inverse Relationship:
Bond prices and yields move inversely. When the 10-year Treasury yield rises, bond prices fall, and vice versa. This is because the fixed coupon payments become less attractive when yields increase, causing existing bond prices to drop to offer comparable yields to new issues.
Current Data (June 13, 2025):
10-Year Treasury yield is around 4.40%, with the bond price near 98.81 (below par), reflecting recent yield increases.
Term Premium:
The term premium on the 10-year Treasury has risen sharply since early April 2025, reaching the highest level in over a decade. This premium compensates investors for risks that short-term yields may not evolve as expected, keeping long-term yields elevated and bond prices suppressed.
2. US100 (Nasdaq 100) and 10-Year Treasury Yield Correlation
Negative Correlation Generally Observed:
The Nasdaq 100 (US100), a tech-heavy equity index, often shows a negative correlation with 10-year Treasury yields. When yields rise, borrowing costs increase, discount rates for future earnings rise, and equities—especially growth stocks—tend to decline. Conversely, falling yields often boost equities.
Recent Trends:
In 2025, rising yields have put pressure on equities, including the Nasdaq 100, as investors demand higher returns from riskier assets. However, periods of yield stabilization or decline can support equity rallies.
Risk Sentiment:
The correlation can vary with market sentiment; during risk-off episodes, both equities and bond yields may fall as investors flock to safety.
3. US100 and Bond Prices
Indirect Relationship via Yields:
Since bond prices move inversely to yields, and yields often move inversely to equities, bond prices and equities like US100 often show a positive correlation in risk-off environments (both falling) and a negative correlation in risk-on environments (equities rising, bond prices falling).
Safe-Haven Demand:
In times of market stress, investors may sell equities and buy bonds, pushing bond prices up and yields down, while equities like US100 decline.
4. Yield Curve and Market Implications
The US yield curve has steepened recently, with the 10-year yield (~4.40%) above the 2-year yield (~3.95%), reflecting expectations of higher long-term inflation and growth risks.
A steepening curve can signal improving growth prospects but also higher financing costs, which can weigh on tech stocks in the US100.
Conclusion
The 10-year Treasury yield and bond prices move inversely, with recent yield increases pushing bond prices below par.
The Nasdaq 100 (US100) typically moves inversely to 10-year yields, as higher yields raise borrowing costs and discount rates, pressuring growth stocks.
The relationship between US100 and bond prices depends on market risk sentiment: in risk-off periods, bond prices rise while equities fall; in risk-on periods, the opposite occurs.
The current steepening yield curve and elevated term premium suggest ongoing volatility and cautious investor positioning affecting both bonds and equities.
#NAS100 #DOLLAR

US100 - Trading within a bearish parallel channel!Introduction
The US100 is currently trading within a well-defined parallel channel to the downside, consistently finding support along the lower trendline and facing resistance near the upper boundary. This structure has led to a clear pattern of lower lows and lower highs on the 1H timeframe. Most recently, price action broke market structure, and we now anticipate a reaction near a high-confluence resistance area.
Parallel Channel
A distinct parallel channel has been developing on the US100 over the past several days on the 1H timeframe. During last night's move, the price touched the lower boundary of the channel and has been trending upward since. After breaking above the midline at $21,640, momentum suggests a potential continuation toward the upper boundary of the channel around $21,830.
FVG
During the most recent downward move, the US100 created a significant 1H Fair Value Gap (FVG), stretching from $21,775 to $21,840. This zone represents a key imbalance that could generate a strong reaction to the downside if price revisits it.
Conclusion
Given the break in structure on the 1H timeframe, short-term upward moves are likely to face resistance. The confluence between the upper boundary of the parallel channel and the 1H FVG creates a high-probability area for price rejection, making it a critical level to watch for potential downside pressure.
Disclosure: I am part of Trade Nation's Influencer program and receive a monthly fee for using their TradingView charts in my analysis.
Thanks for your support.
- Make sure to follow me so you don't miss out on the next analysis!
- Drop a like and leave a comment!

Nasdaq-100 H1 | Approaching a pullback resistanceThe Nasdaq-100 (NAS100) is rising towards a pullback resistance and could potentially reverse off this level to drop lower.
Sell entry is at 21,719.73 which is a pullback resistance.
Stop loss is at 21,870.00 which is a level that sits above the 78.6% Fibonacci retracement and a swing-high resistance.
Take profit is at 21,477.88 which is a multi-swing-low support.
High Risk Investment Warning
Trading Forex/CFDs on margin carries a high level of risk and may not be suitable for all investors. Leverage can work against you.
Stratos Markets Limited (tradu.com ):
CFDs are complex instruments and come with a high risk of losing money rapidly due to leverage. 63% of retail investor accounts lose money when trading CFDs with this provider. You should consider whether you understand how CFDs work and whether you can afford to take the high risk of losing your money.
Stratos Europe Ltd (tradu.com ):
CFDs are complex instruments and come with a high risk of losing money rapidly due to leverage. 63% of retail investor accounts lose money when trading CFDs with this provider. You should consider whether you understand how CFDs work and whether you can afford to take the high risk of losing your money.
Stratos Global LLC (tradu.com ):
Losses can exceed deposits.
Please be advised that the information presented on TradingView is provided to Tradu (‘Company’, ‘we’) by a third-party provider (‘TFA Global Pte Ltd’). Please be reminded that you are solely responsible for the trading decisions on your account. There is a very high degree of risk involved in trading. Any information and/or content is intended entirely for research, educational and informational purposes only and does not constitute investment or consultation advice or investment strategy. The information is not tailored to the investment needs of any specific person and therefore does not involve a consideration of any of the investment objectives, financial situation or needs of any viewer that may receive it. Kindly also note that past performance is not a reliable indicator of future results. Actual results may differ materially from those anticipated in forward-looking or past performance statements. We assume no liability as to the accuracy or completeness of any of the information and/or content provided herein and the Company cannot be held responsible for any omission, mistake nor for any loss or damage including without limitation to any loss of profit which may arise from reliance on any information supplied by TFA Global Pte Ltd.
The speaker(s) is neither an employee, agent nor representative of Tradu and is therefore acting independently. The opinions given are their own, constitute general market commentary, and do not constitute the opinion or advice of Tradu or any form of personal or investment advice. Tradu neither endorses nor guarantees offerings of third-party speakers, nor is Tradu responsible for the content, veracity or opinions of third-party speakers, presenters or participants.

Smart money NASDAQ analysis
🚦 SMART MONEY SIGNAL – NASDAQ H4
You're on the 4-hour (H4) timeframe.
Price tapped the 200 EMA (white line) — commonly seen as a Smart Money Demand Zone.
Strong bullish candle formed = possible rejection from an institutional level.
RSI at 47 = neutral zone, still room to go higher.
---
📊 Smart Money Interpretation:
🟢 Market Structure:
Liquidity sweep below (stop-loss hunt under 200 EMA).
Bullish rejection candle = clear sign of Smart Money involvement.
🔻 Liquidity Grab:
Price broke the recent low then quickly reversed = manipulation phase complete.
Likely H4 Bullish Order Block formed (area of institutional buying).
---
✅ Entry Signal (Buy Setup)
🔹 Direction: Buy / Long
🔹 Entry Zone (Buy Limit):
🔸 Between 21,650 and 21,680
🔹 Stop Loss:
🔸 Just below the wick = 21,570
🔹 Take Profit Levels:
TP1: 21,900
TP2: 22,000
> Targeting imbalance fill + possible structure break
🔹 Risk/Reward Ratio: 1:2 to 1:3 (solid for Smart Money setups)
---
🔁 Entry Confirmation (Lower Timeframe):
Wait for price to pull back into the H4 Order Block.
Look for M15 or M5 bullish reaction (pin bar or bullish engulfing).
RSI > 50 on M30 or H1 = momentum confirmation
🧠 Pro Tip (Smart Money Style):
Draw the H4 Order Block (last bearish candle before the move up). If price returns to this area and shows a strong bullish reaction — you’ve got a high-probability institutional entry. Talion-promosale
-

POSSIBLE BUY OPPORTUNITY ON NAS100Price starting to range in what seems to be an uptrend. We look for a location of unfilled orders to join the trend!

