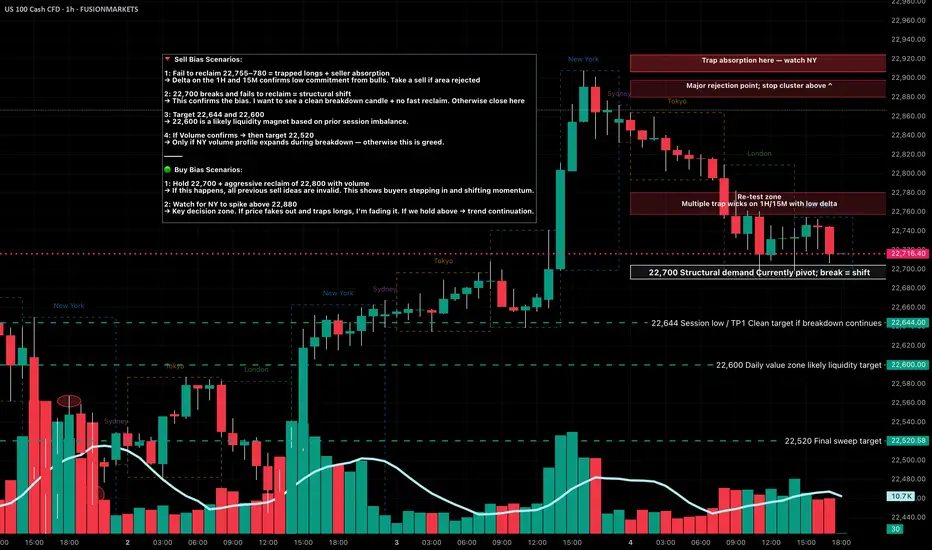
NASDAQ Key Levels July 7 2025If NY fails to reclaim 22,755–780 early in the week, expect a grind back toward 22,644 → 22,600, with 22,520 in play only if volume confirms. Reclaiming and holding above 22,800+ would invalidate this bearish setup.
Watch for trap volume, delta reversals, and volume imbalances at all key zones before entering.
22,880 – 🔻 Weekly wick top
➤ Major rejection zone with a stop cluster sitting above.
22,800–820 – Possible NY trap zone
➤ Trap absorption detected here on footprint — watch New York for rejection or breakout.
22,755–22,780 – Retest zone
➤ Multiple trap wicks with low delta on 1H/15M. Likely to bait breakout traders before fading.
22,700 – Structural demand / pivot point
➤ A clean break + hold below = bearish market shift.
22,644 – ✅ Session low / Take Profit 1
➤ If 22,700 breaks, this is the first clean downside target.
22,600 – Daily value zone
➤ High-probability liquidity target if selling extends below 22,644.
22,520 – Final sweep target
➤ Only likely if New York session sells off hard mid-to-late week.
NAS100 trade ideas
Clear uptrend continuation to 23000+As you can see. We are ascending. All details on chart.
Beware of over leveraged trades. Shorts especially.
NASDAQ:TQQQ NASDAQ:QQQ SKILLING:US100

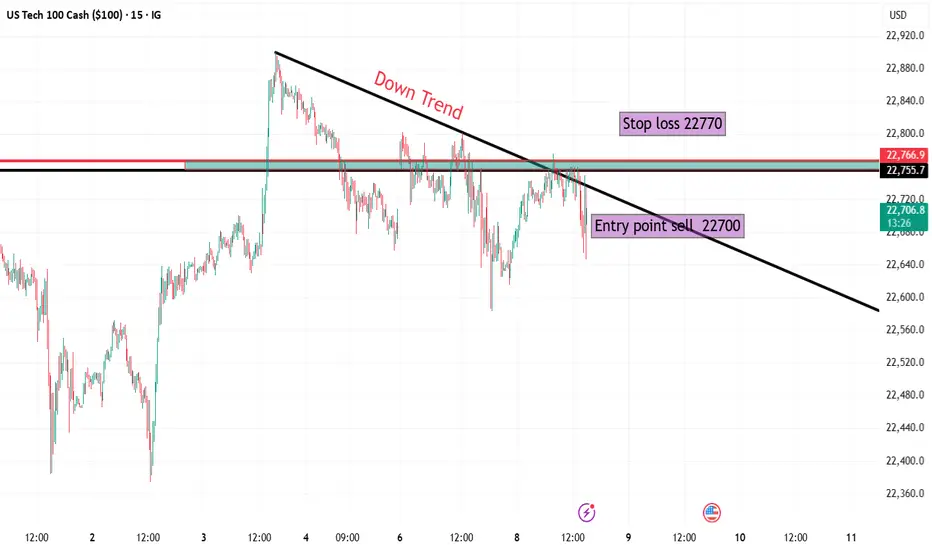
NASDAQ 🔍 Market Overview:
Instrument: US Tech 100 (NASDAQ 100)
Timeframe: 15 Minutes
Current Trend: Short-term downtrend, indicated by the descending trendline connecting recent lower highs.
📉 Trade Setup (Short Position):
Entry Point: 22,700
Price has broken below the trendline and a horizontal resistance zone around 22,750–22,770, confirming bearish pressure.
Stop Loss: 22,770
Placed just above the previous resistance and trendline. A break above this level would invalidate the downtrend structure.
Target: 22,070
This level aligns with a previously tested demand/support zone, offering a logical take-profit area.
📊 Risk/Reward Analysis:
Risk: ~100 points
Reward: ~640 points
Risk-to-Reward Ratio: 1:6, which is excellent and indicates a high potential reward relative to the risk.
📌 Technical Observations:
Trendline: Clearly established downtrend with lower highs.
Breakout Confirmation: Price rejected from trendline + horizontal resistance = confluence zone.
Volume & Momentum (not shown but advisable to check): Traders should confirm the breakout with increased selling volume or bearish momentum indicators (e.g., RSI dropping below 50 or MACD crossing down).
✅ Conclusion:
This is a well-structured short (sell) setup with:
Clear trendline rejection,
Defined entry, stop loss, and target,
A favorable risk-to-reward ratio.
NAS100 (Cash100) Double Top H8Potential short on NAS100.
Risk/reward = 5.4.
Entry = 22 956
Stop loss = 23 059
TP level 1 = 22 473 (50% of position)
T level 2 = 22 303 (50% of position)
RSI divergence.
Waiting for closure of current H8 candle to close in range.
Looking for lower volume on H8 closure, however, will make exception id higher since top 1 was on Thursday the 3rd and markets closed early.

US100 - Reversal after liquidity sweep to target new highs?The chart presented shows a 1-hour analysis of the US100 (Nasdaq 100), illustrating a clean and structured price action narrative. Initially, we observe that the market swept liquidity at the lows, indicated by a sharp wick that pierced beneath the previous support levels. This type of liquidity sweep is common when smart money looks to grab stop-loss orders before reversing the trend.
Liquidity sweep to the downside
Following this liquidity sweep, price action aggressively moved upwards, breaking a lower high structure that had previously marked the bearish control of the market. This break of structure is a key bullish signal, suggesting a shift in momentum from bearish to bullish, and often signifies the beginning of a new upward leg.
1H FVG
An important element on this chart is the 1-hour Fair Value Gap (FVG), initially acting as a bearish imbalance. However, due to the strong bullish momentum, price not only reclaimed this level but did so decisively. As a result, this bearish FVG is now considered a bullish FVG, indicating that it may serve as a support zone on any short-term pullback.
Liquidity taken from the upside
After reclaiming the FVG and breaking structure, price surged further, taking out upside liquidity just above recent highs. This action typically leads to a short-term pullback, as profit-taking and new supply enter the market. The chart suggests that any retracement may find support at the 1H FVG, providing a potential entry point for bullish continuation.
Conclusion
In conclusion, the US100 demonstrated a textbook liquidity grab at the lows, followed by a break in bearish structure, a shift in momentum, and an inversion of a key FVG zone from bearish to bullish. The short-term upside liquidity has been cleared, and the next logical target is the high marked on the chart. Should the price respect the newly formed bullish FVG on any pullback, we can expect continuation toward that upper high, completing the bullish run.
Disclosure: I am part of Trade Nation's Influencer program and receive a monthly fee for using their TradingView charts in my analysis.
Thanks for your support.
- Make sure to follow me so you don't miss out on the next analysis!
- Drop a like and leave a comment!

Nas100 is Still Correcting Nasdaq is Correcting
Long Term we are still Bullish
Remember that markets hunt liquidity
The short term trend is Lower Highs and Lower Lows
Price is still in Premium For Sells
Looking for a retest of previous short term high and my TP would be around 22580
The only way I would get into a buy trade if price would retest the current support and hold with very bullish price action. No little candles etc.

NAS100 High-Risk Momentum Play with Potential H&S SetupNAS100 is hovering near all-time highs. While a retest of the weekly trendline remains likely, this idea aims to ride the current bullish momentum. The plan anticipates a short-term pullback to recent lows to potentially form a head and shoulders pattern before a move lower toward the weekly trendline. This is a high-risk setup I’d typically avoid, but the strong bullish weekly close adds some weight. Two entries provided - one with a tighter TP for a quicker reaction.

Upward momentum of Nasdaq paused by consolidationUpward momentum of Nasdaq paused by consolidation. Now resting on support of trendline. It may continue its upward momentum next week.

NASDAQ 100 | BearishNASDAQ has formed divergence on RSI.And NASDAQ plays divergence almost all the times.Considering it will honor the divergence then NASDAQ is going to enter into a strong correction phase and it may test its support zones.

SellTrend Line Break
Previous Day Volume
Weekly Rejection Point
Untapped Order Point
London - US Session
Three Tap High Structure/ Double Top

NasdaqNon-commercials (hedge funds, asset managers, etc.) are adding significant long exposure.
This usually reflects confidence in continued upside, often in line with strong tech earnings, soft landing narratives, or a dovish Fed.
Bias: Bullish
Large speculators significantly increased long exposure on Nasdaq futures, showing strong confidence in continued upside momentum. This aligns with recent tech-led rallies and soft-landing expectations.

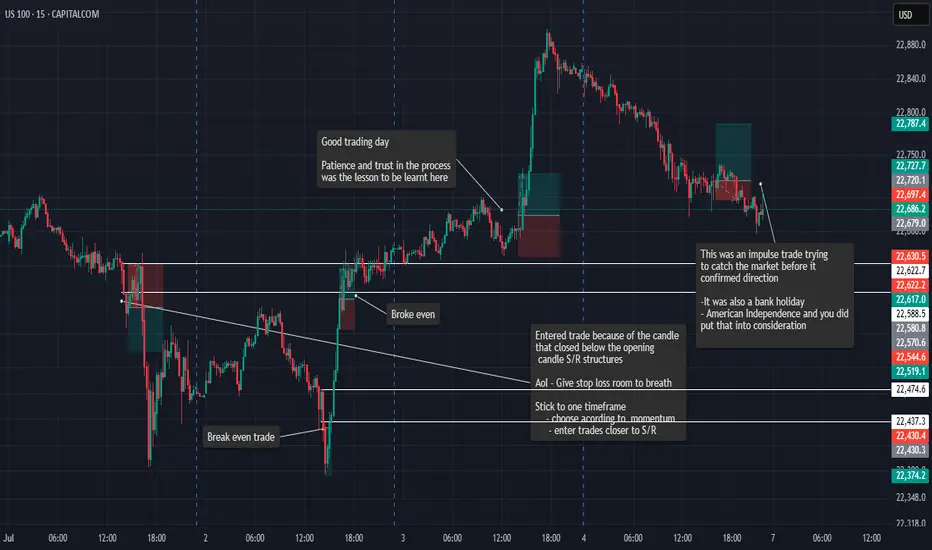
Last Weeks Trades and AnalysisWeek 1 - Trade reviews
This is a look back at the trades i tooks and the lessons taken from that day, More information is in my trading journal
US100 Short From Resistance!
HI,Traders !
US100 is weaker than we
Expected and failed to break
The key horizontal level
Around 22868.6 and we are
Now seeing a bearish rejection
So we are locally bearish biased
And we will be expecting a
Further bearish move down !
Comment and subscribe to help us grow !

NQ: Upcoming Weekly analysis!FA Analysis:
1- Tariff On/Off: The noise will continue this week as well. Europe will be the target this week.
Uncertainty OR Eternity pause? Market might tend towards Eternity pause which is positive for stocks and equities.
2- New Earnings season: This will be on the driver seat for the next few weeks. Positive earnings for major stocks will impact positively NQ and vice-versa.
3- Macroeconomic data:
CPI and PPI will be relevant for July rate cut. Lower and inline inflation will be very good for July Rate cut; hence very good for Equities. Higher inflation data will be bad.
Also, Consumer sentiment and Inflation expectations, later in the week, will be very relevant.
So from FA Analysis, US equities might go either direction based on data outcomes.
TA Analysis:
Weekly TF: Direction is Buy!
The weekly close was irrelevant; it was inside the bullish green candle. Price must break and close below or above the master weekly candle to establish clear direction.
So nothing to trade from weekly perspective.
Daily TF: Direction is Neutral!
Same as weekly TF, we got an irrelevant daily close, inside the previous daily green candle (red dotted lines).
Price must break and close either below or above the dotted red lines for a clear direction.
Hourly TF: Direction is Neutral!
Based on the Weekly and Daily TF, clearly price is consolidating and looking for FA data to make decision on the next move.
Price is making LL-LH-HL-HH... and switching from one side to another reinforcing the consolidation.
Here are two scenarios:
Scenario 1: Good earnings, macroeconomic data and lower inflation will trigger a new ATH.
Scenario 2: Bad earnings, macroeconomic data and higher inflation will trigger a retrace.
Happy green week!

The Nasdaq rally might be reaching its limits… The Nasdaq rally might be reaching its limits…
When priced in gold, a massive topping structure is morphing into existence.
Final breakdown coming?

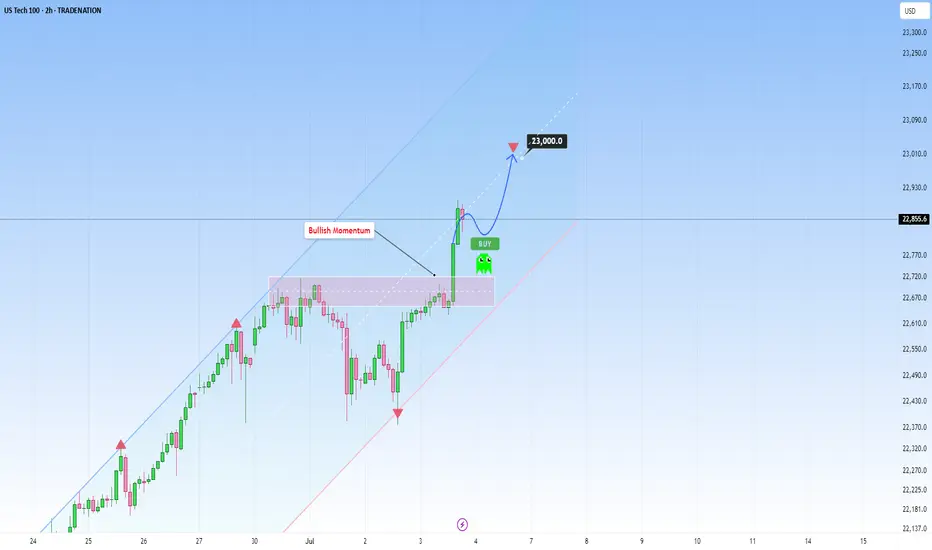
US100 rises sharply, with further upside target of 23,000At this stage, US100 continues to ride a dominant ascending channel structure, maintaining a consistent bullish structure supported by strong fundamentals as well as technical positioning.
The current price action reflects a high-confidence trend environment, underpinned by steady economic resilience in the U.S. tech sector and growing investor optimism surrounding AI-driven growth and corporate earnings. This alignment between structure and sentiment reinforces the strength of the current trend.
What’s especially encouraging is how the price has remained in the upper half of the ascending channel. Every corrective move has been shallow and absorbed quickly as well. This kind of behavior is exactly what you want to see in a strong trend.
From a structural perspective, the recent break of the prior swing high confirmed a bullish break of structure (BOS), reinforcing the broader uptrend. That’s a meaningful move, not just technically, but also psychologically, as it validates that bullish momentum remains intact and market participants are still positioning for higher levels.
No signs of weakness are showing up yet. If anything, the structure is intact and there’s no evidence of a shift in momentum. This makes it a good opportunity for traders who are "late to the party" to consider entering, as the trend still looks strong and continuation is likely.
As for upside targets, the 23,000 level is a natural extension. It aligns with the middle of the channel and fits within the current rate of expansion. If we don’t see any warning signs (like impulsive bearish candles), this target remains both technically justified and psychologically relevant.
Just sharing my thoughts on support and resistance, this isn’t financial advice. Always confirm your setups and manage your risk properly.
Disclosure: I am part of Trade Nation's Influencer program and receive a monthly fee for using their TradingView charts in my analysis.
NASDAQ | - Structure Refined | Bullish Intent Into Next WeekPair: NAS100
Bias: Bullish
Timeframes: 4H, 2H, LTFs
• 4H broke structure to the upside with a new HH — clear sign of bullish intent stepping in.
• 2H gives clarity on the move — beginning of the week was messy, but price cleaned up nicely and gave us refined structure to work with.
• Now we wait for mitigation into the OB zone to see if price respects and gives us the setup.
🔹 Entry: After price mitigates OB and confirms with CHoCH on LTFs
🔹 Entry Zone: Marked OB zone — wait for confirmation
🔹 Target: Near structure highs — continuation if bulls step in
Mindset: Messy beginnings don’t mean bad outcomes. Structure eventually reveals the truth — just stay patient and ready.
Bless Trading!

USNAS100 Key Level: 22,740 – Will the Trend Continue or Reverse?USNAS100 Update – Bullish Momentum Holds Above 22,740
USNAS100 has continued to push higher, following through as expected from yesterday’s analysis.
The index maintains bullish momentum as long as it trades above the key pivot at 22,740.
However, a 1H close below 22,730 could trigger a bearish correction toward 22,615.
A sustained break below that level may shift the trend to bearish.
Key Levels:
• Resistance: 22,870 / 23,000
• Support: 22,615 / 22,410

USTEC 15M Trade Setup Analysis (TCB Strategy)📊 USTEC 15M Trade Setup Analysis (TCB Strategy)
Trade Type: Countertrend Breakout -> Continuation
Symbol: USTEC (NASDAQ 100 Index)
Timeframe: 15-Minute
Entry Zone: Around 22,500
Resistance Zone: 22,587.90
Target: 22,865.84
Stop Loss: 22,458.87
Risk–Reward: 1:3 (approx)
Structure: Falling wedge breakout into bullish channel
Setup Confidence Score: 95%
📝 Analyst Notes
Price is breaking out from a well-defined falling wedge within a rising channel. Entry around 22,500 is based on breakout momentum, with SL tucked under structure. A retest entry would offer added confluence. Resistance at 22,587.90 is critical—a break and hold above confirms bullish strength toward the 22,865 target.
🎯 Execution Plan
Option 1: Aggressive entry near 22,500–22,540 (early breakout)
Option 2: Wait for clean retest of wedge breakout or 22,500 zone
Target: 22,865 (upper channel boundary)
SL: 22,458 or below the recent structure low
R:R: ~1:3 — very favorable
🟢 Verdict
This is a high-quality TCB setup, especially if we get a retest confirmation. The bounce off channel support + wedge breakout = excellent confluence.

Nasdaq ready for pullback??Hi Guys,
The US indices have been ripping back to all time highs without any meaningful pullbacks from the lows.
The Nasdaq is approaching a price level where we may see a pullback and some selling pressure.
The shaded box above the chart is that area and it contains two important fib levels. The bottom of the box is the 1.13 retracement of the recent high to the low after the tarrif news. The black line drawn through the box is the 2.0 retracement of the bear market high to low. This level is always important but it is more significant in this case because the SP 500 and Dow Jones both had the big drops from pretty much exactly this level. The Nasdaq failed to reach this level so if the other two indices are anything to go by we may see some selling here.
Daily RSI is showing divergence. Sell setups using break of structure chart pattern and candlestick patterns on lower time frame could result in nice risk to reward trades.
The red line coming from the bottom is the AVWAP and its no coincidence that it is in line with a n obvious support area should we get a deep enough pullback.
Safe Trading all

NAS100 4H – Bullish Breakout Continuation BUY SetupUS100 (NAS100) is showing clear bullish strength after reclaiming 22,500.0, now trading around 22,718.0. The structure remains bullish, with higher highs and higher lows forming cleanly.
Buyers are still in control — looking for continuation to the upside.
---
BUY Trade Plan:
🔵 Buy Limit: 22,650.0 – 22,680.0
🛑 Stop Loss: 22,600.0
🎯 Take Profit 1: 22,800.0
🎯 Take Profit 2: 22,950.0
---
Why Buy?
✅ Strong bullish market structure.
✅ Recent pullback held above previous support levels.
✅ Momentum favoring upside continuation after minor retracement.
Smart Money likely to drive price higher after liquidity grab around 22,650 zone.
---
Summary:
Bias: BUY ONLY 🔥
Setup: Wait for price to pull back into 22,650 – 22,680, enter long on confirmation.
Risk Management: Respect SL and TP levels — no emotions.
---
💬 Are you buying NAS100 too? Drop your thoughts below!
#NAS100 #US100 #Indices #TradingView #SmartMoney #BuySetup #FrankFx14

NAS100 UPDATE - Potential Targets Dear Friends in Trading,
How I see it,
Key Support / Pivot @ 22665.00
If key support holds, bullish rally can potentially remain intact
A strong breach below 22605.00, can potentially force
price back to original demand.
I sincerely hope my point of view offers a valued insight.
Thank you for taking the time to study my analysis.

#NDQ - Monthly Targets: 23721.73 or 21387.86?Date: 03-07-2025
#NDQ - Current Price: 22641.89
Pivot Point: 22554.80 Support: 22276.15 Resistance: 22835.11
Upside Targets:
Target 1: 23028.36
Target 2: 23221.62
Target 3: 23471.67
Target 4: 23721.73
Downside Targets:
Target 1: 22082.06
Target 2: 21887.98
Target 3: 21637.92
Target 4: 21387.86
