US100/Analysis *📊 US100 (NAS100) – 4H Analysis & Trade Signal*
---
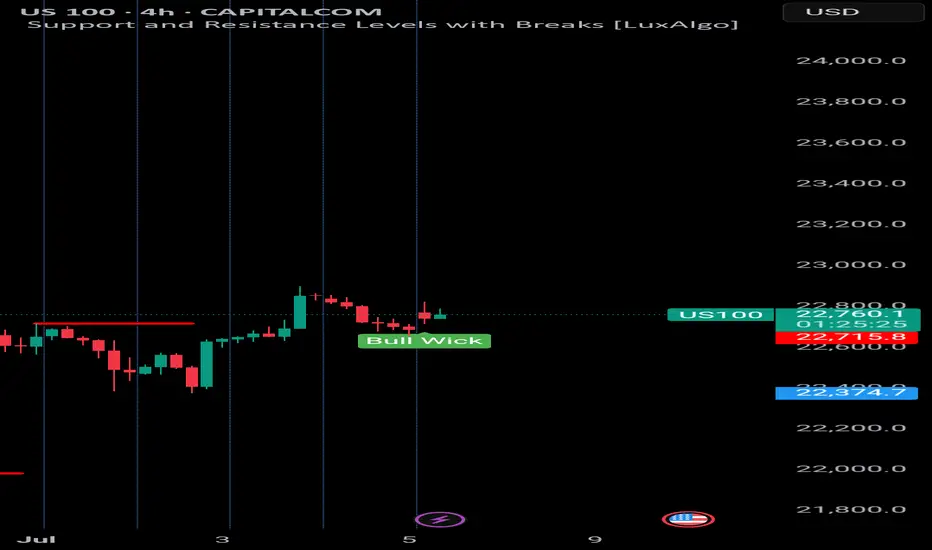
*🔎 Chart Observation:*
- *Current Price:* 22,764
- *Structure:* Market rejected downside strongly with a *Bull Wick* (demand zone reaction).
- *RSI (14):* 60.38
- Momentum is rising again, just under overbought.
- *Bearish divergence* still visible, but price is defending structure.
---
*📌 Key Levels:*
- *Support:* 22,715
- *Resistance:* 22,865 → 23,000
- *Strong Bullish Zone:* 22,720–22,750
---
*📈 Trade Idea: BUY Setup*
- *Entry:* 22,760–22,770
- *SL:* 22,690 (below wick)
- *TP1:* 22,865
- *TP2:* 23,000
- *TP3 (optional):* 23,150 if breakout occurs
---
*🧠 Smart Money View:*
- Likely a *liquidity sweep* below wick zone.
- Demand zone got respected → smart money possibly reloading longs.
- If next candle closes bullish, more confirmation for continuation.
NAS100 trade ideas
Upward momentum of Nasdaq continues.Upward momentum of Nasdaq continues. Geo-political Tensions cooling down.

Discount Zone Reversal Play Entered a long position after identifying an short formed W formation within discount territory, mapped from yesterday’s high–low range. Price action showed clear structural symmetry, with the second leg completing at a key demand zone.
📌 Buyside liquidity at 22,692.27 acted as the inducement level—price swept it and respected the zone, signaling smart money accumulation.
Key Confluences:
- Extended W structure with balanced legs and volume support
- Price operating below EQ before trigger, favoring bullish reversal
- TP placed just above EQ to anticipate reaction without overextending
- Structure confirmed by neckline retest and bullish candle ignition
This setup aligns with a classic liquidity sweep and reversal narrative, targeting measured premium zones while managing drawdown with tight risk control. The trade is guided by structure, liquidity, and session timing—a patient play with clean narrative flow.


#NDQ - Weekly Targets 23197.39 or 21886.08 ?Date: 03-07-2025
#NDQ - Current Price: 22641.89
Pivot Point: 22541.74 Support: 22335.83 Resistance: 22748.58
#NDQ Upside Targets:
Target 1: 22832.49
Target 2: 22916.40
Target 3: 23056.89
Target 4: 23197.39
#NDQ Downside Targets:
Target 1: 22251.45
Target 2: 22167.08
Target 3: 22026.58
Target 4: 21886.08

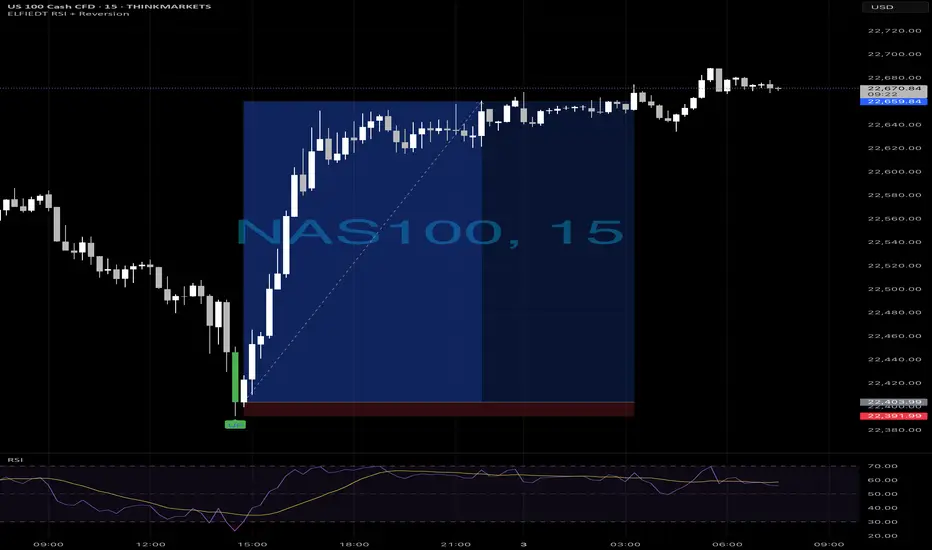
Ustec - longs📈 NAS100 Long Reversal — Powered by ELFIEDT RSI + Reversion Indicator
Timeframe: 15-min
Instrument: NAS100 (US Tech 100)
⸻
✅ Signal Setup (Long Entry)
This clean reversal was captured using my custom ELFIEDT RSI + Reversion indicator, which detects:
• RSI-based exhaustion conditions
• Precise reversal signals (green “UP” label on the chart)
• Trend-aligned confirmations
⸻
📌 Entry Criteria:
1. Oversold RSI conditions signaled potential exhaustion of the downtrend.
2. A clear bullish reversal candle closed with confirmation from the indicator.
3. The “UP” label marked the ideal entry candle just before the impulsive breakout.
4. RSI momentum shifted positively at the point of signal.
⸻
🎯 Execution Plan:
• Entry: At close of the signal candle with the “UP” label
• Stop-Loss: Placed just below the recent swing low (see red zone on chart)
• Target: Up to previous intraday structure and recovery zone
⸻
💡 Key Observations:
• Early signal allowed high RR entry before breakout
• RSI structure confirmed direction shift
• Strong sustained price action into close
⸻
📚 Learn More:
This trade is part of a larger system combining:
• RSI signal dynamics
• Momentum shift detection
• Session and structure alignment
If you’d like more information about the indicator or how to use it in your own strategy, feel free to follow or reach out.
#NAS100 Buy 22499.8#NAS100 Buy 22499.8
SL 21899.8
TP 22699.8
TP 23499.8
TP 24899.8
Trade at your own risk
Protect your capital
The Wizard 🧙♂️ SWFX

ICTTrading foreign currencies can be a challenging and potentially profitable opportunity for investors. However, before deciding to participate in the Forex market, you should carefully consider your investment objectives, level of experience, and risk appetite. Most importantly, do not invest money you cannot afford to lose.
There is considerable exposure to risk in any foreign exchange transaction. Any transaction involving currencies involves risks including, but not limited to, the potential for changing political and/or economic conditions that may substantially affect the price or liquidity of a currency. Investments in foreign exchange speculation may also be susceptible to sharp rises and falls as the relevant market values fluctuate. The leveraged nature of Forex trading means that any market movement will have an equally proportional effect on your deposited funds. This may work against you as well as for you. Not only may investors get back less than they invested, but in the case of higher risk strategies, investors may lose the entirety of their investment. It is for this reason that when speculating in such markets it is advisa

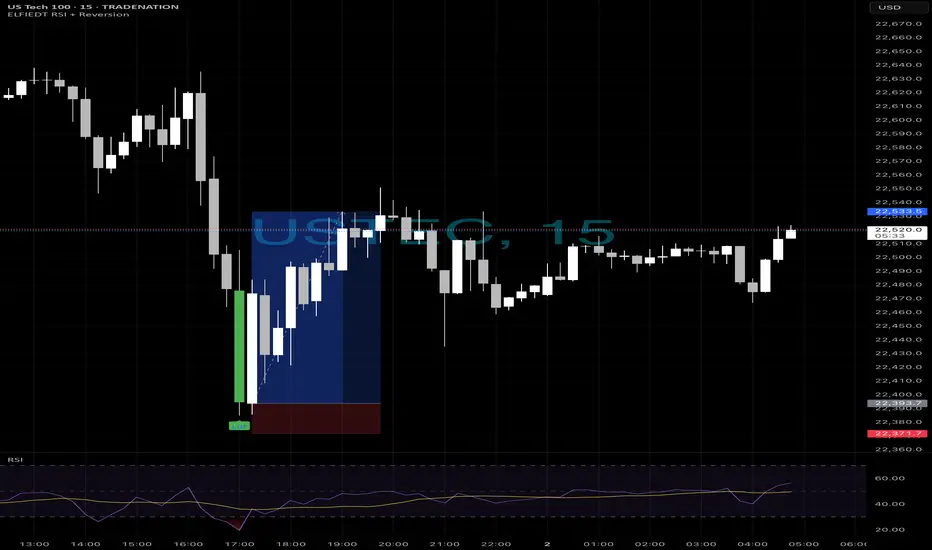
Usrec longs after drop📈 US Tech 100 | 15-Min Chart
✅ Live Trade Example using ELFIEDT RSI + Reversion
⸻
This setup was captured using the ELFIEDT RSI + Reversion indicator. A clean BUY signal was triggered after an extended move, followed by a sharp reversal — perfectly timed and visually confirmed by the indicator’s built-in logic.
💡 The result? A precise entry with a strong follow-through.
This tool is built to spot high-probability reversals with confluence — across timeframes, instruments, and volatility conditions.
⸻
👥 Want to trade with structure and clarity?
Join our community of traders who use this system daily to simplify their decisions and sharpen their edge.
📩 Comment “🔥” or send a DM to learn more.
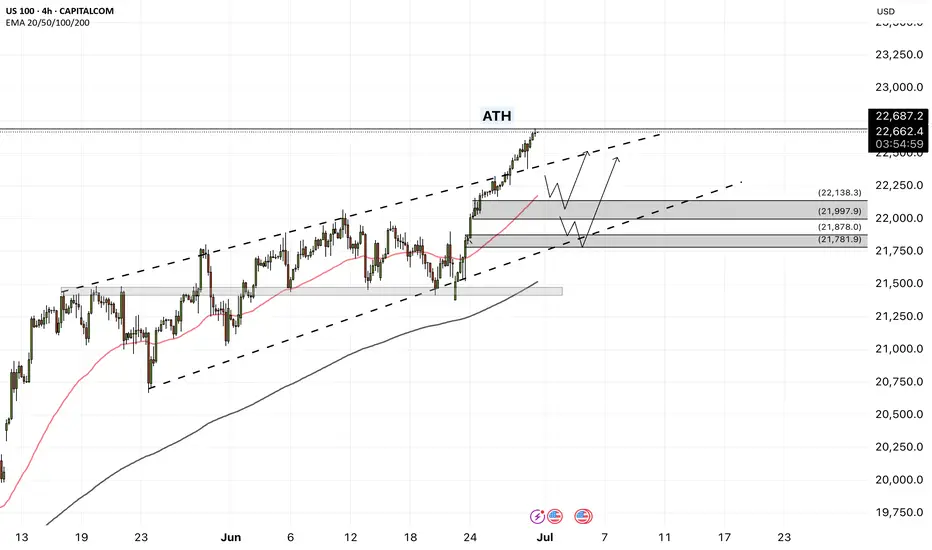
NAS100 - The stock market is breaking the ceiling!The index is above the EMA200 and EMA50 on the four-hour timeframe and is trading in its medium-term channels. If it does not increase and corrects towards different zone, it is possible to buy the index near the reward.
Following a strong rally in U.S.equities, the S&P 500 and Nasdaq indices both achieved new all-time highs on Friday. It marks the first time since February that the S&P 500 has surpassed its previous peak, while the Nasdaq entered fresh price territory for the first time since December.
Despite ongoing market focus on economic data and the Federal Reserve’s interest rate policy path, the simultaneous surge in both indices reflects a renewed appetite for risk in the stock market—an appetite that has been accelerating since mid-April, especially in tech stocks.
In contrast, the Russell 2000 index, which tracks small-cap U.S. companies, still remains significantly below its prior high. To return to its October levels, it would need to rise over 13.5%. However, Friday’s 1.7% gain suggests capital is beginning to flow more broadly into underrepresented sectors.
Analysts argue that a strong breakout in the Russell 2000 could signal a broader rotation toward increased risk-taking—possibly driven by optimism over future rate cuts, easing inflation, and improved business conditions in the second half of the year.
Now that the S&P 500 has reached new highs and the Nasdaq has joined in, attention turns to the Russell 2000. If it begins to accelerate upward, markets could enter a new phase of sustained bullish momentum.
Following a week focused on gauging U.S. consumer spending strength, the upcoming holiday-shortened week (due to Independence Day) will shift attention to key employment and economic activity data.
On Tuesday, markets await the ISM Manufacturing PMI and the JOLTS job openings report. Wednesday will spotlight the ADP private employment report, and Thursday—one day earlier than usual due to the holiday—will see the release of several crucial figures, including the Non-Farm Payrolls (NFP), weekly jobless claims, and the ISM Services Index.
Currently, investor reaction to Donald Trump’s tariff commentary has been minimal. Market participants largely believe that any new tariffs would have limited inflationary effects and that significant retaliation from trade partners is unlikely.
Friday’s PCE report painted a complex picture of the U.S. economy. On one hand, inflation remains above ideal levels; on the other, household spending is showing signs of fatigue—a combination that presents challenges for policymakers.
Inflation-adjusted personal consumption fell by 0.3%, marking the first decline since the start of the year and indicating a gradual erosion of domestic demand. While wages continue to rise, their impact has been offset by declining overall income and reduced government support. To maintain their lifestyle, households have dipped into their savings, driving the personal savings rate down to 4.5%—its lowest level this year.
On the inflation front, the core PCE price index—the Fed’s preferred inflation gauge—rose 2.7% year-over-year, slightly above expectations. Monthly inflation also increased by 0.2%. Although these figures appear somewhat restrained, they remain above the Fed’s 2% target, with persistent price pressures in services—particularly non-housing services—still evident.
Altogether, the data suggest the U.S. economy faces a troubling divergence: weakening household income and consumption could slow growth, while sticky inflation in the services sector—especially under a potential Trump tariff scenario—could limit the Federal Reserve’s ability to cut interest rates.
NAS100!Nasdaq is clearly in either the start or the end of a consolidation
The trend is still up.
Trade with care use a stop loss

Comprehensive Market Analysis: NAS100 Comprehensive Market Analysis: NAS100
1. Monthly Timeframe (The Long-Term "Big Picture")
Observation: The chart displays an incredibly powerful and long-standing uptrend. The price is consistently making higher highs and higher lows.
Candlestick Analysis: The most recent candles are strong, long-bodied bullish (green) candles. There are no significant bearish reversal patterns present whatsoever. This is a picture of strength.
Ichimoku Analysis: The price is trading far above the Kumo (Cloud), which is wide and bullish (green). The Tenkan-sen is far above the Kijun-sen, and the Chikou Span is in open space high above the price action from 26 periods ago. This is a textbook example of a very strong, healthy bull market.
Conclusion (Monthly): The long-term outlook is unequivocally Bullish.
2. Weekly Timeframe (The Dominant Trend)
Observation: The strength seen on the monthly chart is confirmed here. The trend is clearly defined and moving from the lower-left to the upper-right.
Heikin Ashi Interpretation: If we were to view this with Heikin Ashi, this chart would show a long sequence of green candles, with most of them having no lower wicks, which, according to your lesson, signifies a very strong and healthy uptrend.
Ichimoku Analysis: All five Ichimoku components are in perfect bullish alignment. The price is above the Tenkan-sen, which is above the Kijun-sen, and all are far above the Kumo. This confirms the trend is not only bullish but also has strong momentum.
Conclusion (Weekly): The dominant trend is Strongly Bullish.
3. Daily Timeframe (The Trading Trend)
Observation: The chart shows a clear uptrend. The most recent price action shows a slight pullback or pause after making a new high.
Candlestick Analysis: The last few candles are smaller and show some indecision (like Spinning Tops), which is very common after a strong upward move. This is more likely a "breather" or consolidation rather than a reversal. There are no major bearish reversal patterns like a Bearish Engulfing or Evening Star.
Ichimoku Analysis: The price is pulling back towards the Tenkan-sen, which is the first line of dynamic support. As long as the price holds above the Kijun-sen, the bullish trend is considered fully intact.
Conclusion (Daily): The trend is Bullish, currently in a minor pullback. The overall structure remains strong.
4. 4-Hour and 1-Hour Timeframes (The Intraday Trend)
Observation: These charts give a clearer view of the minor pullback seen on the daily chart. Here, the price action is moving sideways to slightly down.
Candlestick Analysis: We can see a few Long Upper Shadow candles near the recent top, which confirms the lesson that sellers stepped in to cause this short-term pause. However, there is no strong follow-through yet from the bears.
Ichimoku Analysis: On the 4H chart, the price is testing the Kijun-sen as support. This is a critical level. If it holds, the uptrend is likely to resume. If it breaks below, the correction could deepen, with the Kumo cloud being the next major support zone.
Conclusion (4H & 1H): The short-term momentum is corrective/sideways within a larger bullish trend.
5. Lower Timeframes (30M, 15M, 5M)
Observation: These charts show the corrective price action most clearly, appearing as a short-term downtrend.
Context is Key: Based on the overwhelming strength of the Monthly, Weekly, and Daily charts, this downtrend on the lower timeframes must be interpreted as counter-trend noise. It is a pullback, not a reversal of the major trend.
Harmonic Potential: This pullback could be forming the BC leg of a bullish ABCD pattern, or the AB leg of a bullish Gartley or Bat pattern, where traders would look for a buying opportunity at a key Fibonacci retracement level below.
Overall Synthesis and Final Conclusion
By performing a correct, top-down analysis of the NAS100 charts, the conclusion is the complete opposite of my previous mistaken analysis.
Long-Term (Monthly/Weekly): The market is in a powerful, secular bull market.
Medium-Term (Daily): The primary trend is up, but the market is taking a healthy and expected pause or pullback.
Short-Term (Intraday): The market is currently in a corrective phase.
Final Outlook: The multi-timeframe analysis is in strong alignment. The overwhelming evidence suggests that the primary trend for NAS100 is strongly Bullish. The current downward price action on the lower timeframes is very likely a temporary correction. Traders who align with the dominant trend would view this dip as a potential buying opportunity as the price approaches key support levels (like the Kijun-sen on the 4H/Daily chart), anticipating a resumption of the main uptrend.
For those interested in further developing their trading skills based on these types of analyses, consider exploring the mentoring program offered by Shunya Trade.
I welcome your feedback on this analysis, as it will inform and enhance my future work.
Regards,
Shunya Trade
⚠️ Disclaimer: This post is educational content and does not constitute investment advice, financial advice, or trading recommendations. The views expressed here are based on technical analysis and are shared solely for informational purposes. The stock market is subject to risks, including capital loss, and readers should exercise due diligence before investing. We do not take responsibility for decisions made based on this content. Consult a certified financial advisor for personalized guidance.

Upward momentum of Nasdaq has broken major resistanceUpward momentum of Nasdaq has broken major resistance.

Trade alert triggered! Tiqgpt setupAnalyzing the US Tech 100 CFD across multiple timeframes, we observe a consistent bullish momentum from the daily down to the 1-minute chart. The daily and 4-hour charts show a series of strong bullish candles, indicating a robust institutional buying presence. The 1-hour chart confirms this trend with a continuation of bullish candles, although there's a slight pullback visible, suggesting a temporary liquidity grab before further upward movement. The 15-minute charts show a more detailed view of this pullback, which appears to be a healthy correction within a broader bullish trend. The 1-minute chart shows increased volatility and some consolidation, typical of lower timeframes where retail traders are more active.
INSTITUTIONAL THESIS: Institutions are likely in a phase of accumulation and distribution, using pullbacks to gather more positions before pushing the price higher. The consistent higher highs and higher lows across timeframes suggest a strong bullish bias. The recent pullbacks on lower timeframes are likely temporary, serving to trap bearish retail traders before continuation of the uptrend.
LEARNING POINT: The pullback seen on the 1-hour and 15-minute charts can be interpreted as a liquidity grab, where institutions are likely stopping out weak bearish positions before continuing the bullish trend. This is a classic example of "stop hunt" before trend continuation.
SIGNAL: BUY SYMBOL: US Tech 100 CFD ENTRY PRICE: $22,500.0 STOP LOSS: $22,480.0 (Below the recent minor pullback on the 15-minute chart) TARGET PRICE: $22,600.0 (Just below the recent highs to ensure liquidity for exit) CONDITION: Buy limit order at $22,500.0 following a confirmed bullish reaction off the $22,500.0 level on the 15-minute chart RATIONALE:
Market Structure: Consistent higher highs and lows across all timeframes.
Order Flow: Institutional buying evident from large bullish candles.
Liquidity Behavior: Recent pullbacks likely represent liquidity grabs.
Pressure Analysis: Strong bullish candles indicate institutional pressure.
Strategies Used: Liquidity grab and continuation, intraday accumulation. URGENCY: MEDIUM TIMEFRAME: Short-term CONFIDENCE SCORE: 85% (Based on the clear bullish structure and institutional buying signs) **RISK/REWARD RATIO: Risk=$20.00, Reward=$100.00, Ratio=1:5.0
Risk = $22,500.0 - $22,480.0 = $20.0
Reward = $22,600.0 - $22,500.0 = $100.0
Ratio = $100.0 / $20.0 = 5.0

Nasdaq Analysis before market .If you do a top down analysis you will see /nq potentially working in the bulls favor. Especially if you own tech stocks. Its been steadily rising. with a couple hick-ups but look at the arrows on the 1 hour timeframe. The VWAP was showing a peak and than dropping. The chart soon to follow. Reversing. Yesterdays top and bottom were in line with an continuation and big $$$ taking profit,s than continued up the mountain.
Have a good day.

Nasdaq100OANDA:NAS100USD
3. And Then price will begin to push down strong. This will happen only if there will be a very strong spike meaning an incredible amount of sells pushing the price down.

US100 BULLISH BREAKOUT|LONG|
✅US100 is going up
Now and the index made a bullish
Breakout of the key horizontal
Level of 22,222 and the breakout
Is confirmed so we are bullish
Biased and we will be expecting
A further bullish move up
LONG🚀
✅Like and subscribe to never miss a new idea!✅
Disclosure: I am part of Trade Nation's Influencer program and receive a monthly fee for using their TradingView charts in my analysis.

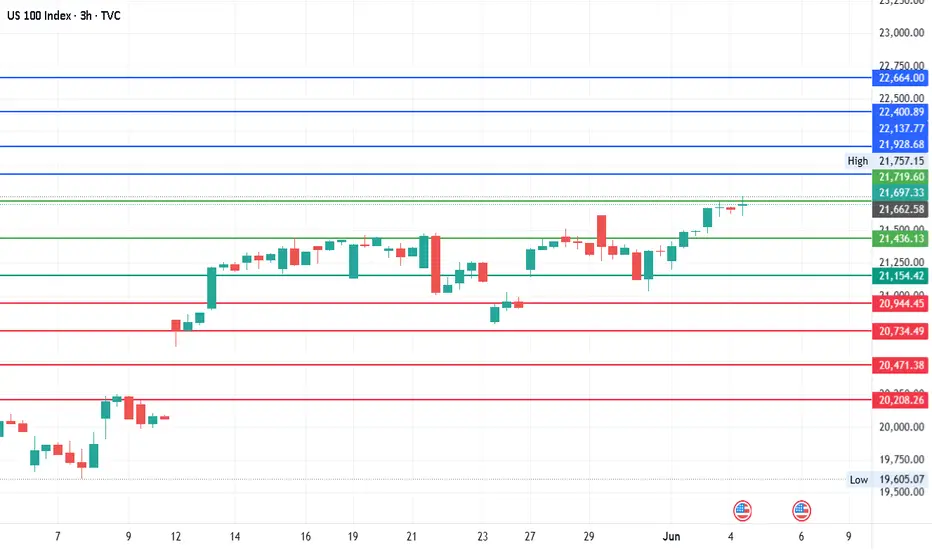
#NDQ - Pivot Point: 21,436.13Date: 30-05-2025
#NDQ Pivot Point: 21436.13 Support: 21154.42 Resistance: 21719.60
Upside Targets
Target 1: 21928.68
Target 2: 22137.77
Target 3: 22400.89
Target 4: 22664.00
Downside Targets:
Target 1: 20944.45
Target 2: 20734.49
Target 3: 20471.375
Target 4: 20208.26
NQ Shorts Into Sellside Liquidity (26/06/2025)
Tracked this trade live as price swept buyside liquidity at 22,300.59, forming a potential short-formed M pattern. Watched for confirmation and waited patiently through a small bullish pullback, identifying potential trap behavior rather than true continuation.
Once a bearish market structure shift (MSS) occurred—confirmed by a body close below the prior wick low—I executed a short position, targeting the sellside liquidity shelf at 22,166.92, aligned with Asian session lows. Dimmed HeatMap clusters beneath suggested institutional interest, supporting a high-probability setup.
Trade thesis:
- Liquidity sweep at 22,300.59
- Rejection with fading momentum and wick absorption
- MSS confirmation with strong-bodied candle
- Dimmed clusters and multiple marked sellside levels below
Execution: Sniper short after MSS confirmation. Trade is live and managed with defined targets and narrative context. Let’s see how deep this bleed runs.

Nasdaq short on ltf Let us see if it manipulates the ny highs and reverses to the downside.
Trying out this short.

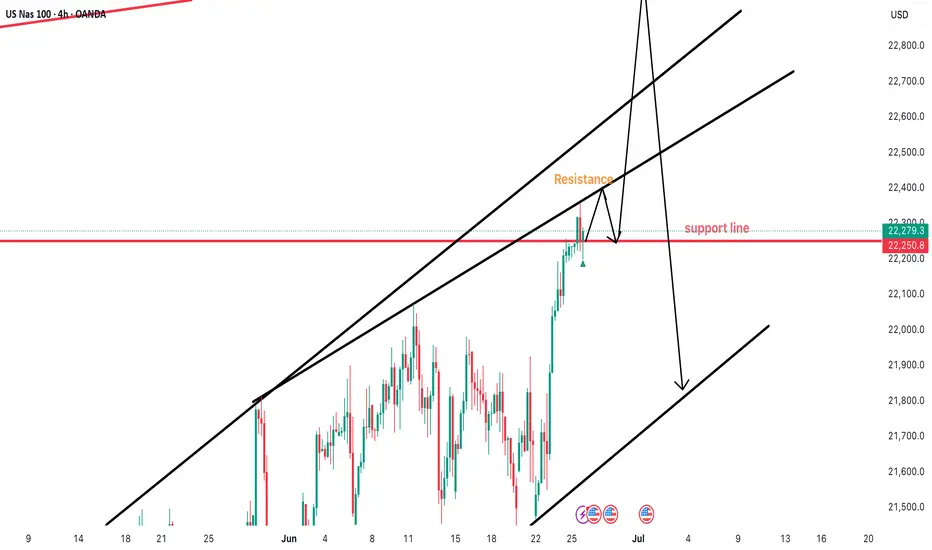
nasdaq100OANDA:NAS100USD
has reached the previous highest level.
We see that the trendline has made a high possibility of the nasdaq 100 to reach a new high level because the price has gone above the previous high level, and came back to test it.
Now the price is going back up. It is fascinating as to what nasdaq100 will do next and how
other indices will be affected, including Gold and forex...
My opinion on nasdaq100:
1. It has made a different move compared to the previous high levels when they reached this level. Previously when the price reached the horizontal line (the resistance level) price began to push down and create very long spikes.
2. Nasdaq100 will go way too high and spike on that highest trendline. Spike from that level thereby create a new resistance level.
3. And then price will begin to push down strong. This will happen only if there will be a very strong spike meaning an incredible amount of sells pushing the price down.
NAS100 BERISH MOVEPrice broke support. respected resistance. Looking at a bearish trend down. Any ideas or suggestions please let me know.

US100 - USTEC - Sells....📉 Textbook Short with ELFIEDT – RSI + Reversion
Instrument: US Tech 100 (USTEC)
Timeframe: 15-Minute
Date: 25 June 2025
Indicator: ELFIEDT RSI + Reversion
🔍 What Happened:
On 25 June, just after the New York open, ELFIEDT’s “DOWN” signals triggered in rapid succession—right near the session high around 22,296.
The market had been pushing upward aggressively, but ELFIEDT detected a shift in momentum and printed multiple clear short signals before the reversal even began.
💰 The Outcome:
Price dropped sharply from the signal zone, falling more than 70 points shortly after.
Anyone following the system’s guidance would have had:
✅ A clean short entry
✅ A tight risk level (just above the signal candle)
✅ A fast move in their favor
This is exactly how the ELFIEDT system is designed to operate—catching turning points early and cleanly.
📌 Why It Matters:
ELFIEDT doesn’t just follow price. It detects exhaustion, imbalance, and timing shifts with precision—giving you clear, visual BUY and SELL labels on the chart.
You don’t need to second guess or overanalyze—just follow the signals.
📈 Trade with Confidence:
This chart is a perfect example of how ELFIEDT helps traders stay ahead of reversals, avoid chasing, and trade with structure.
Let the indicator do the heavy lifting—your job is execution.
