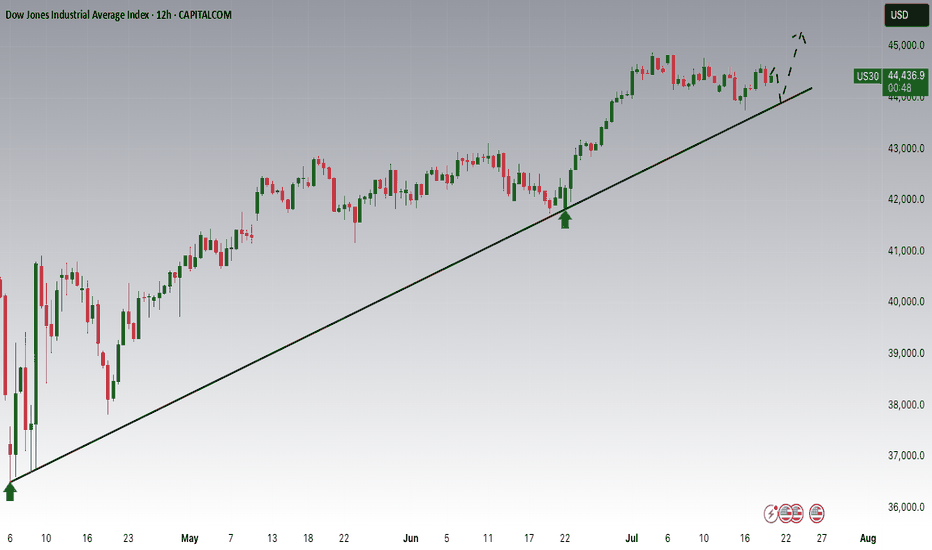
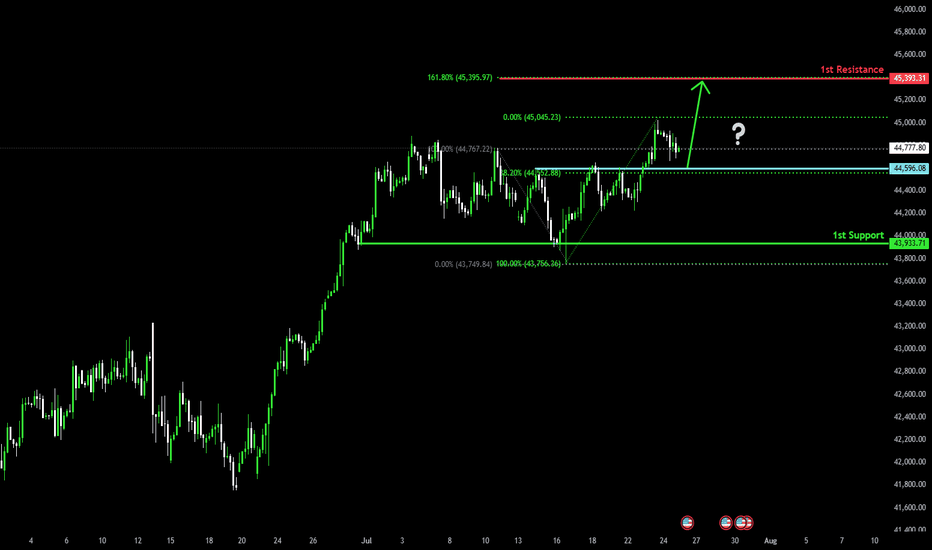
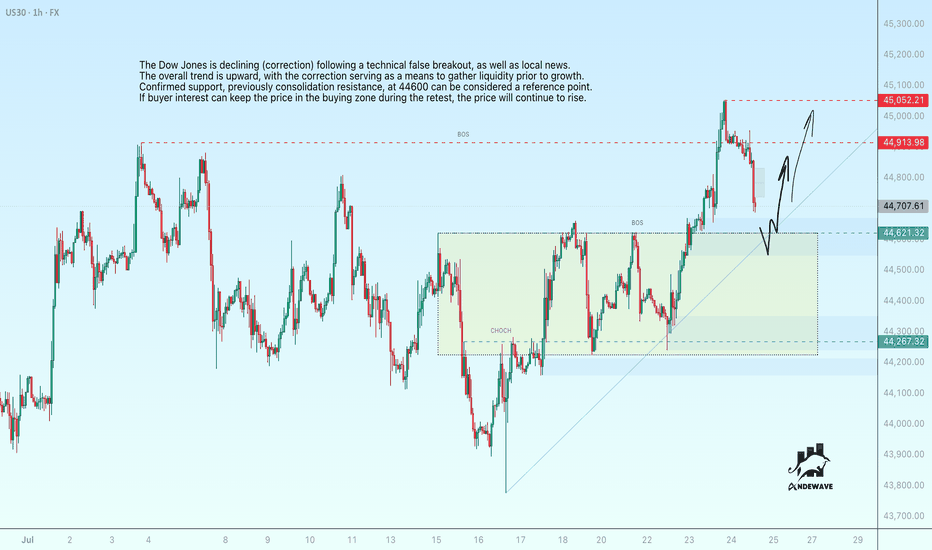
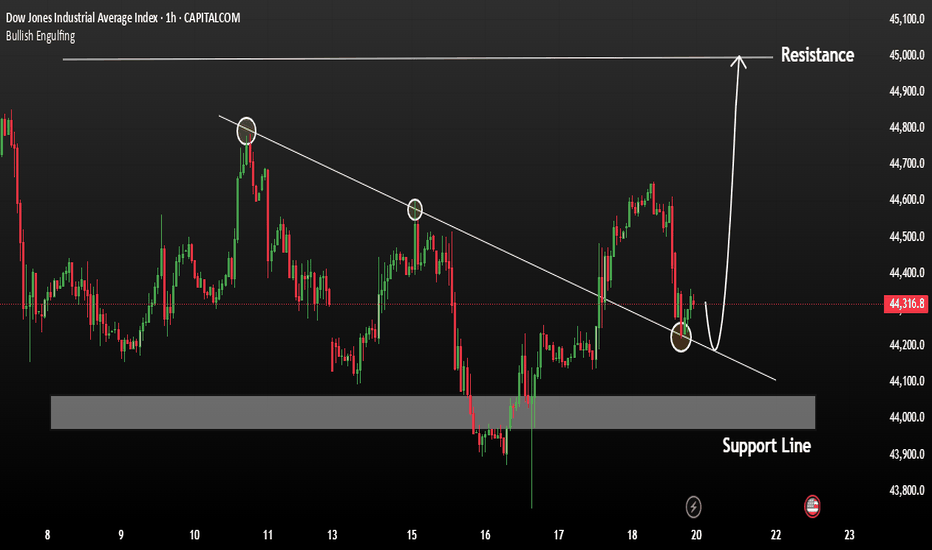
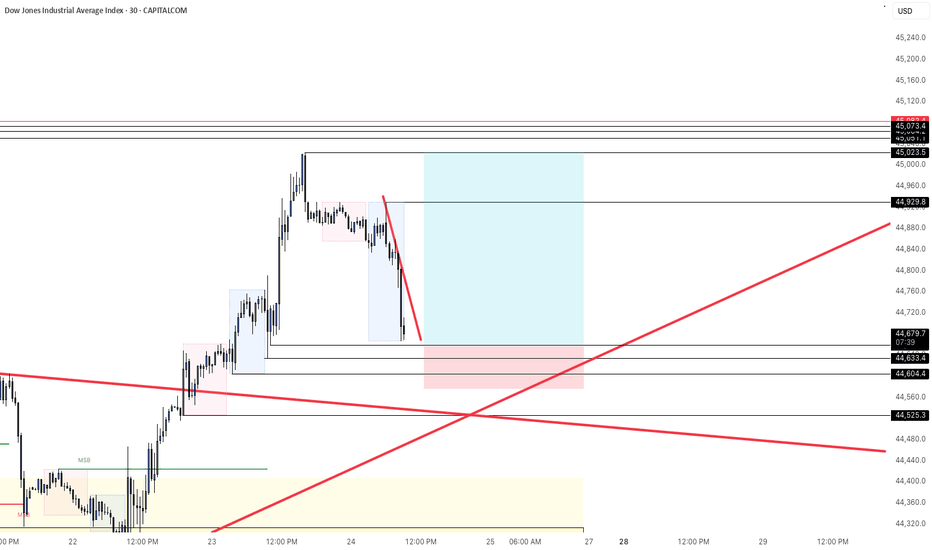
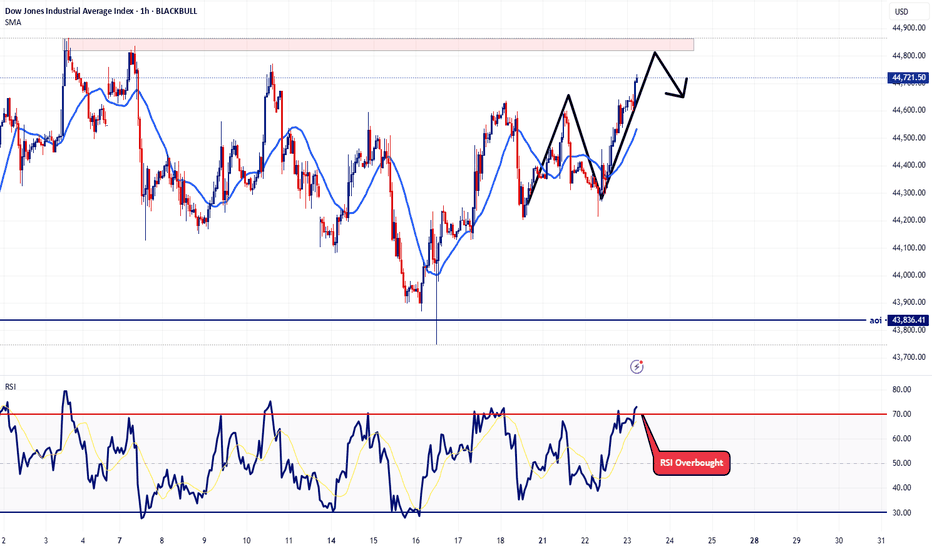
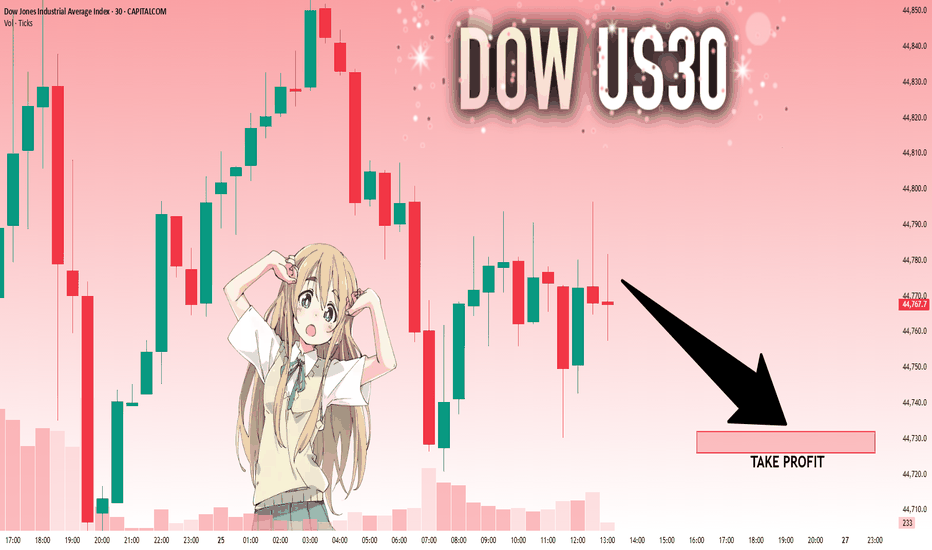
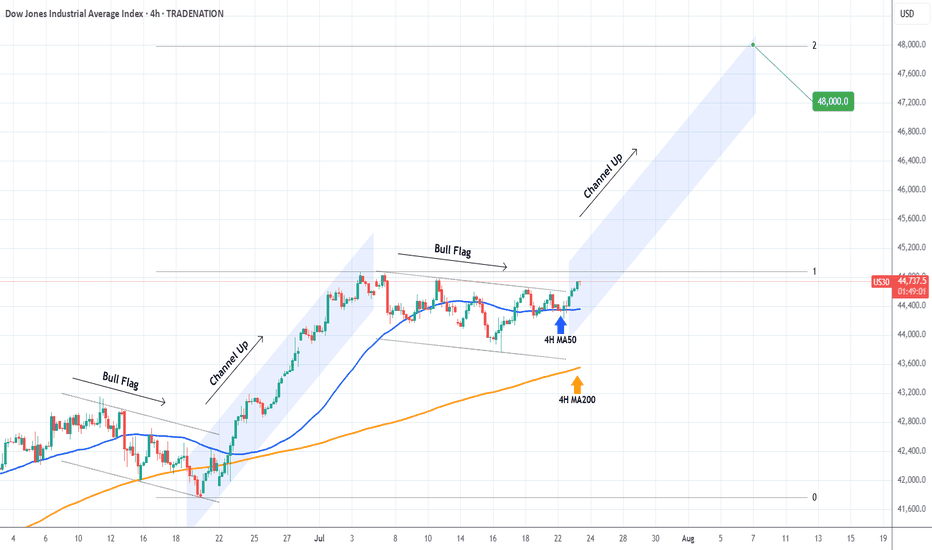
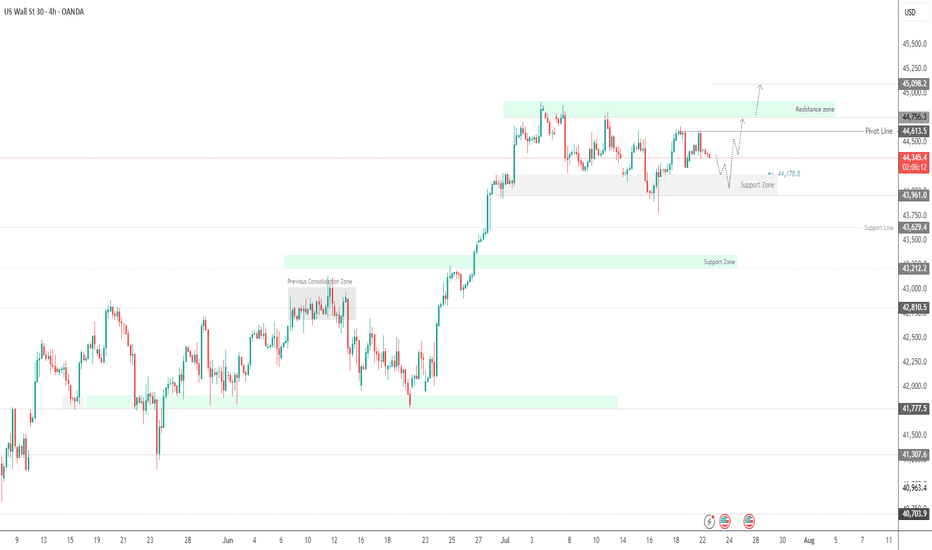
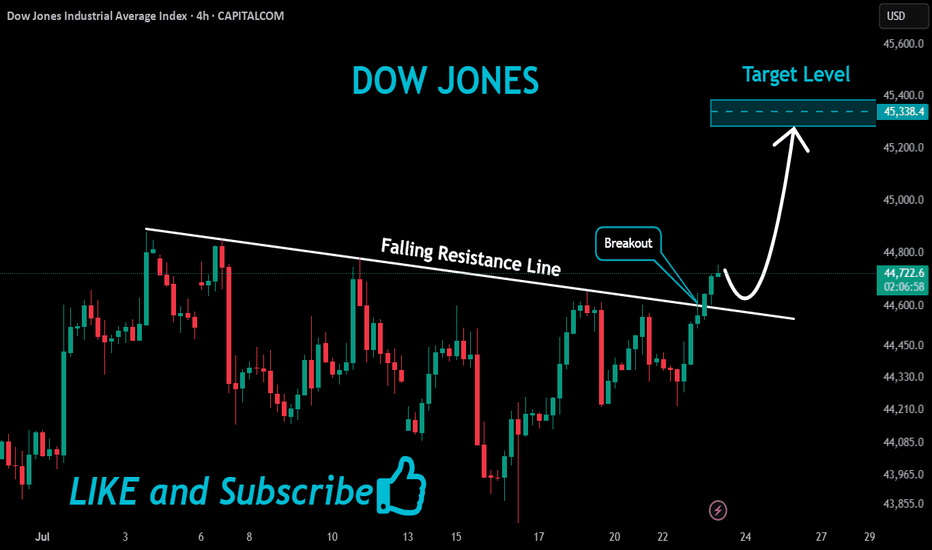
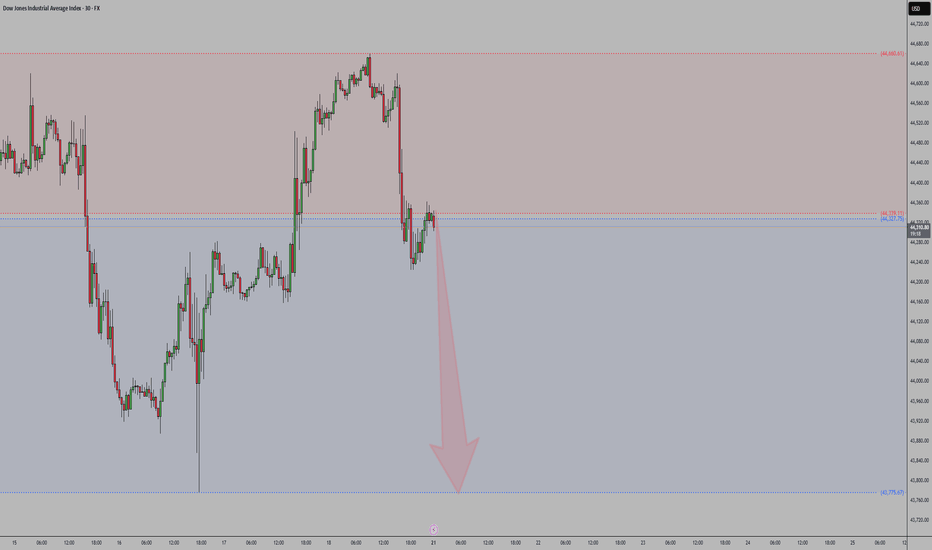
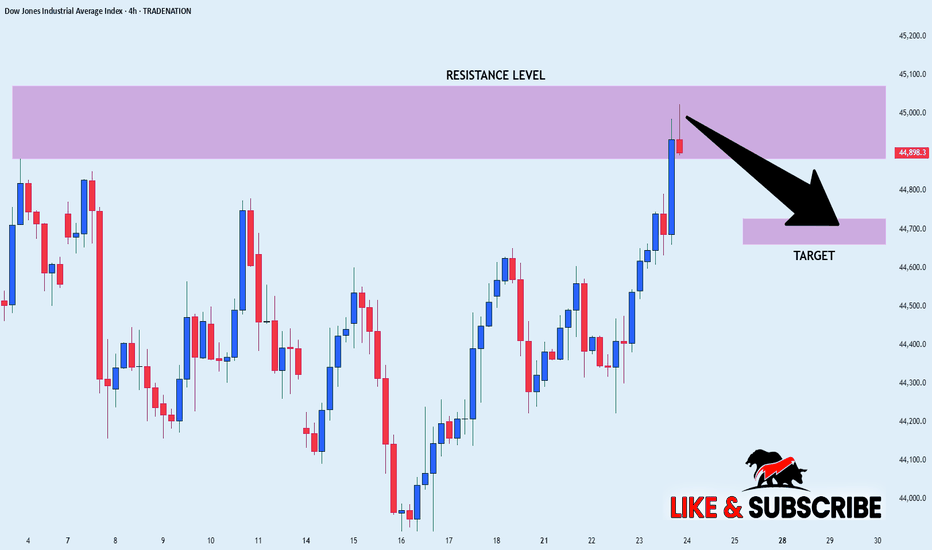
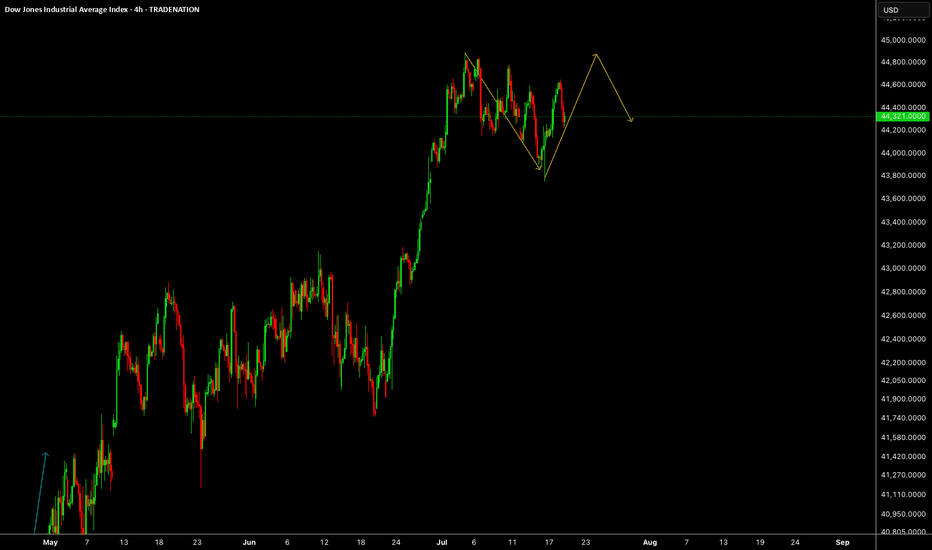
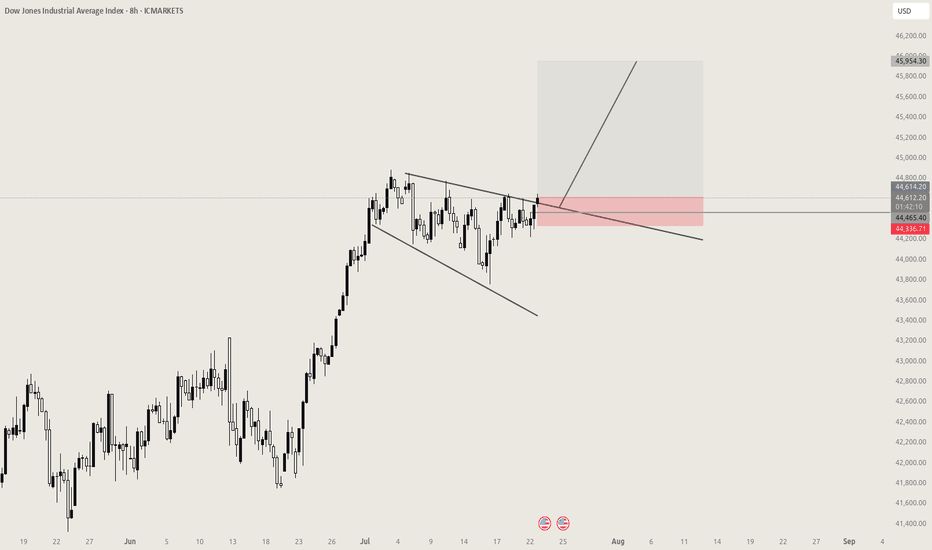
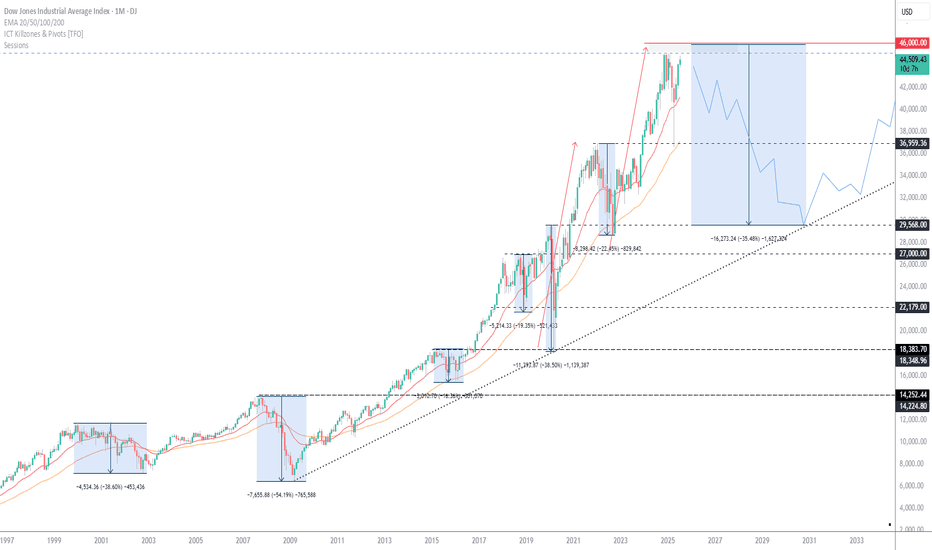
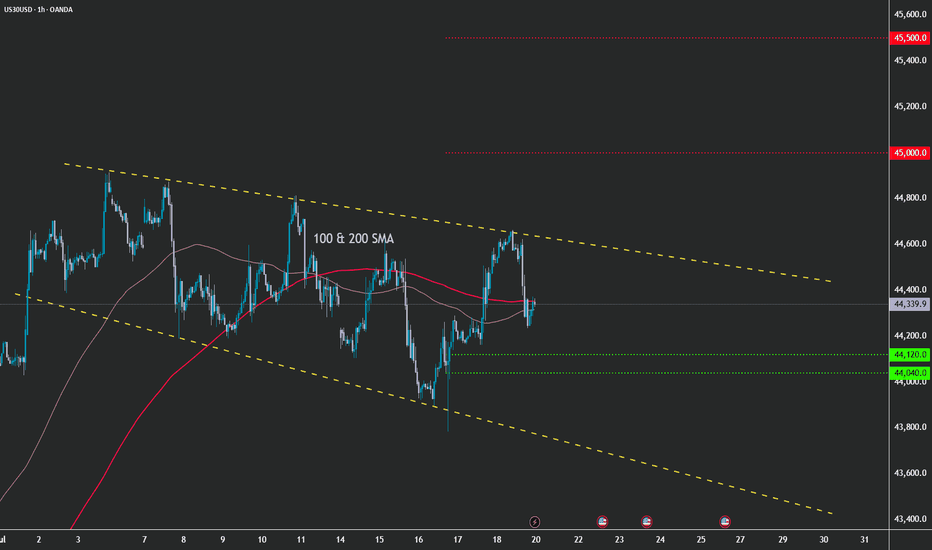
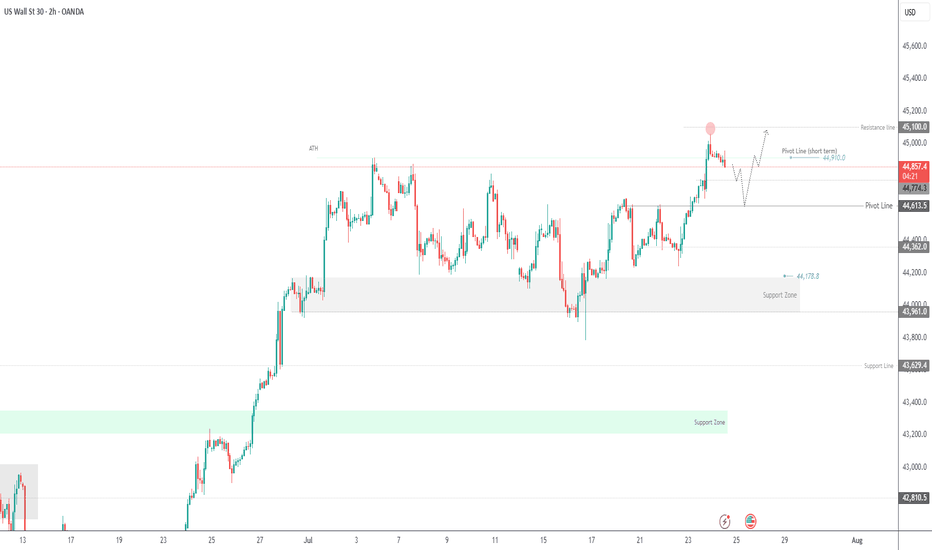
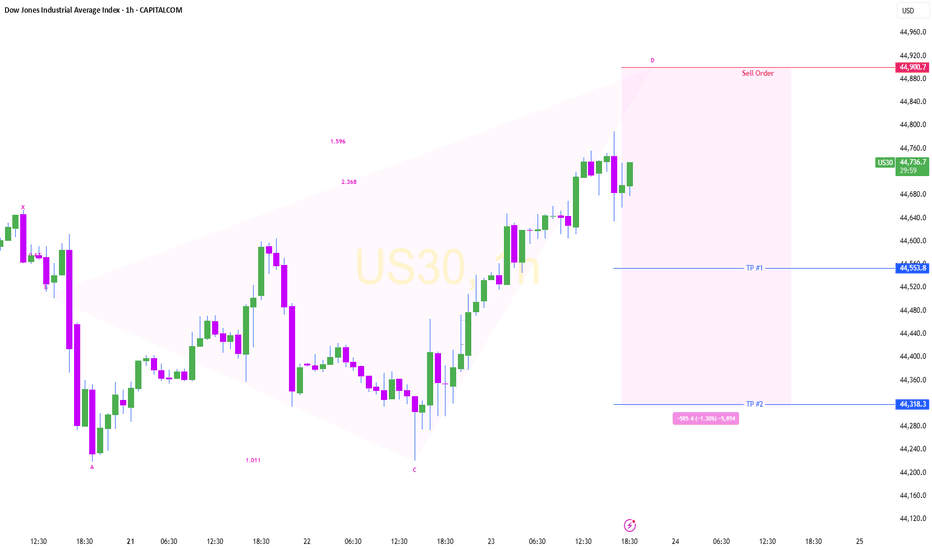
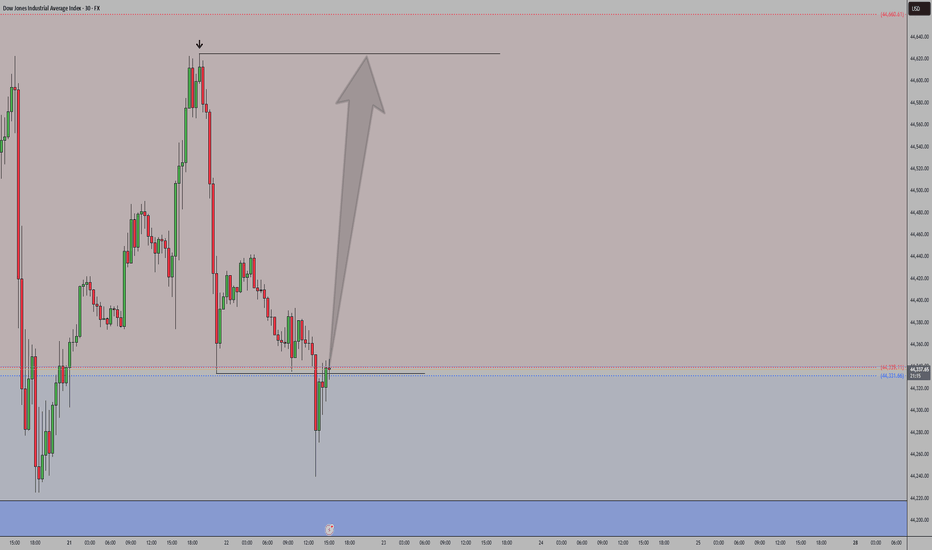
Us30 longYearly entry 42000 Higher low Dollar weakness incoming Demand 2025 longLongby Master_Traders_MTA7710
Updated idea for the last idea of US 30 (importat!) 27.12.24Hi, How are you doing? Merry Christmas )) ** The used time frame is the daily and I would suggest to open the chart and zoom out, so all will be clearer than how it looks now. ** As you see, the index failed in making another 5th HL, as it went down than the 4HL already and intends to do a lower low currently. ** Have a look now on the blue curved line which points to high tops with high resistance points and they are both at my Fib 50% level! which adds another layer of resistance. ** Also have a look on the previous daily candle which ended up in green, but with an unfilled wick which I assume that it will be filled today when the index moves to the downside. ** The index continued in pushing up the price at the last few days, as a normal reaction after the past 2 bearish weeks. But NO WAY that it could go and close the day candle above the lower yellow line of the rising channel. And by looking at that yellow line, you would easily see that it acted as an uptrend line (as a normal thing of the lower line of the rising channel anyway) and then was broken then the pull back pushed the price up to the current level. but now we have the Fib level, plus the curved blue line tops which are all including the yellow line acting as extra huge and so powerful resistance zones to avoid the index from going more upwards. ** By looking at the daily uptrend line in purple which was not broken since 23.10.2023 that will have to be visited and more likely will be the point which the index is heading down to! ** Also when the index is going down starting from today, hopefully as planned, will mean too the breaking of the uptrend blue line and will send the index to its bottom and that will support the more my idea! ** By going further to my TP will mean a pullback to the red downtrend line which was finally broken by the daily candle of 23.12.2024 then it will act as a support zone to the index for sure! ** The red flag is the TP price where the purple line and the red line will be touched there. **********NOOOOOTE** It is important to monitor when the index reaches to the purple line on the daily frame and immediately close your short trades once it touches that uptrend purple line! whatever the price could be! as I expect an immediate bullish retrace once it touches it! Note: My ideas are exclusive to myself only and is not regarded as an advice for traders or investors and are not more than personal thoughts which I just wanted to share with you all and I do hope they could help. I am not selling any signals and I do not take money favour any trades recommendations. They are free of charge all lifelong but I keep the copy rights of them though to not be copied or shared or sold. by moustafa_mareiUpdated 3319
DOW JONES Bullish accumulation below the 1D MA50.Dow Jones (DJI) has been trading within a Channel Up since the July 18 High. Right now the price is consolidating between its bottom (Higher Lows trend-line) and the 1D MA50 (blue trend-line). At the same time, the 1D RSI breached the oversold barrier (30.00) and rebounded. This trading sequence has presented the most efficient buy opportunity since April 19 2024 and the even though all Bullish Legs that followed have been a little over +8.00%, the weakest one has been +7.63%. As a result, our current Bullish Leg Target of 45235 is formulated out of that minimum. ------------------------------------------------------------------------------- ** Please LIKE 👍, FOLLOW ✅, SHARE 🙌 and COMMENT ✍ if you enjoy this idea! Also share your ideas and charts in the comments section below! This is best way to keep it relevant, support us, keep the content here free and allow the idea to reach as many people as possible. ** ------------------------------------------------------------------------------- 💸💸💸💸💸💸 👇 👇 👇 👇 👇 👇Longby TradingShot24
US30 4H - LONG TERMDow Jones Analysis - LONG TERM Introduction The market is showing signs of potential movement in both directions. The key levels are highlighted, and the invalidation points are clearly defined to manage risk effectively. Market Expectation Market Start: At the beginning of the market, I expect a move downward, followed by a failure to break below 42400, showing weakness in the market. A subsequent bullish move is expected, targeting 43550, then a correction to 40600, followed by a final bullish surge toward 47000. Invalidation Levels A break below 42400 with confirmation would invalidate the initial bullish scenario and suggest further downside potential. A failure to sustain above 43550 or a breakout below 40600 would invalidate the upward movement and signal further bearish pressure. Trading Strategy Entry: Enter near key reversal points and levels, with confirmation from indicators or price action. Risk Management: Set stop loss at levels such as 42400 or 40600 depending on the trade direction to limit potential losses. Conclusion The key levels are established with clarity, and the expected movements in the Dow Jones are outlined. Traders should be cautious about the key support and resistance zones for better risk management and potential profit. High-precision analyses, amazing results! Shortby GreyFX-NDS1114
US30 1HIn the previous analysis , I expected a correction to begin about 150 points lower. If the 43,470 level is maintained, the market direction remains bearish, and the target has been updated with a slight correction. A break below the 43,470 level, even by just one point, would invalidate the analysis, and the market direction would turn bullish. Let’s wait to see if buyers show their strength and then make our judgment. "High-precision analyses, astonishing results!" Wishing you a New Year filled with success, health, and happiness! by GreyFX-NDS2219
What Is the DJIA, and How Can You Trade It?What Is the DJIA, and How Can You Trade It? The Dow Jones Industrial Average (DJIA) is one of the world’s most recognised stock indices, often seen as a barometer for the US economy. Tracking 30 influential companies, the DJIA offers insights into market trends and economic shifts. This article explores what the DJIA represents, how it’s constructed, and how to trade it. Dow Jones Definition The Dow Jones Industrial Average, usually abbreviated to DJIA or DJI, is one of the most well-known stock indices globally, often called simply "the Dow." This index tracks 30 of the publicly traded companies in the US, including major names like Apple, Boeing, and Goldman Sachs. Designed to represent a cross-section of the American economy (although it does not include utilities or transportation companies), the DJIA provides a snapshot of market sentiment and economic health through the performance of these companies. The DJIA was founded in 1896 by Charles Dow and Edward Jones, initially with 12 major industrial companies. Over time, Dow Jones Industrial Average companies evolved to include corporations across diverse sectors, though it's worth noting that these are all large-cap companies, meaning they have substantial market values. Importantly, the Dow is price-weighted, meaning in DJIA, a stock’s price directly affects the index value — stocks with higher prices hold more influence over the index's movements than those with lower prices. So, a stock priced at $300 will impact the DJIA more than one priced at $100, even if the latter company is larger in overall market value. For example, high-priced DJIA stocks like Goldman Sachs or UnitedHealth often drive the index’s movements more than lower-priced yet substantial companies like Cisco. As a result, the index is unique compared to indices weighted by market capitalisation, like the S&P 500. The Dow’s movements can reflect broader market trends, but it provides less of a complete representation of the economy or stock market than the S&P 500 or Russell 2000 since it includes only 30 companies. Nonetheless, traders often look to the Dow Jones index as an indicator of market strength or weakness. When these 30 companies perform well, it often signals broader economic optimism; when they struggle, it can be a sign of potential downturns. Components and Weighting of the DJIA The Dow Jones Industrial Average consists of 30 large-cap US companies across sectors like technology, finance, healthcare, and industrials. Changes to the DJIA’s stocks are rare but do happen when companies no longer reflect the US economic landscape. For instance, a business facing long-term decline may be replaced by a rising industry leader to keep the index relevant. These decisions are made by a committee that aims to ensure the DJIA remains a meaningful snapshot of the economy despite its relatively small roster of companies. What Stocks Are in the Dow Jones? As of November 2024, there are several notable and well-recognised companies in the Dow, including: - Apple Inc. - Microsoft Corporation - Amazon.com Inc. - The Coca-Cola Company - Goldman Sachs Group Inc. - Johnson & Johnson - McDonald's Corporation - Boeing Company - Visa Inc. - Procter & Gamble Co. Factors Affecting the DJIA’s Movements The DJIA can swing up or down due to various factors, reflecting shifts in the economy, company-specific developments, and broader market sentiment. The primary elements driving the index include: - Economic Indicators: Key data releases, like GDP growth, employment reports, and inflation rates, directly impact the DJIA. Strong economic indicators tend to lift the index as they suggest a healthy business environment, while weaker data can pull it down, signalling potential challenges for major companies. - Interest Rates: Interest rate changes, particularly from the Federal Reserve, play a significant role. When rates rise, borrowing becomes more expensive, which can reduce corporate profits and weigh on the Dow Jones Industrial Average’s stocks. Conversely, lower rates often encourage investment and consumer spending, which can boost the index. - Corporate Earnings Reports: Quarterly earnings announcements from the 30 DJIA companies are critical. Positive earnings results can lift the Dow, especially if they beat market expectations and are from one of its pricier components. Conversely, disappointing earnings can drag down the index, especially if they reflect broader industry or sector weaknesses. - Global Events: Major global developments, like geopolitical tensions, trade agreements, or health crises, can quickly shift market sentiment. For instance, the onset of the COVID-19 pandemic caused sharp declines in the DJIA as economic concerns spiked. - Sectoral Influence: The DJIA’s performance can be significantly impacted by trends within particular sectors, especially those with higher-priced stocks. For instance, if several tech companies in the index perform well, they can drive up the DJIA, given their substantial influence. - Market Sentiment: General market optimism or fear often moves the DJIA, influenced by factors like investor confidence, media coverage, and broader economic outlooks. Indicators such as the VIX (volatility index) can help gauge this sentiment and reflect periods of heightened volatility. Trading the DJIA with CFDs While traders have various ways to access the Dow Jones Industrial Average—from ETFs to futures—many prefer trading DJIA Contracts for Difference (CFDs) for their flexibility and accessibility. CFDs allow traders to speculate on the DJIA’s price movements without owning the actual assets in the index. One of the benefits of CFDs is that they enable both long and short positions, so traders can potentially take advantage of rising or falling markets. CFDs also allow for leveraged trading, meaning traders can control a larger position with a smaller upfront investment. However, leverage amplifies both potential returns and risks, making risk management essential when trading CFDs. For those interested in DJIA CFDs, FXOpen provides access to these contracts in our TickTrader platform under the Dow ticker WS30m, giving traders an easy-to-use, responsive way to monitor and trade the index. How Traders Analyse the DJIA Traders use several analysis methods to interpret the DJIA’s movements, aiming to understand trends, gauge sentiment, and identify potential trading opportunities. Some of the most common approaches include: Fundamental Analysis Fundamental analysis involves examining economic data and financial statements of DJIA companies. Traders look at metrics like revenue growth, earnings, and profit margins to gauge the health of the companies within the index. Broader economic indicators, such as unemployment rates or consumer confidence, are also essential in understanding how macroeconomic conditions may impact the Dow. Technical Analysis Many traders rely on technical analysis to spot trends and key price levels. Common tools include moving averages, which smooth out price data to identify direction over time, and support and resistance levels, which highlight areas where the DJIA price has historically paused or reversed. Trendlines help traders visualise the overall direction, and indicators like the Relative Strength Index (RSI) show whether the index might be overbought or oversold. Market Sentiment and Positioning Analysis Gauging the mood of the market is crucial, especially with an index as prominent as the DJIA. Sentiment analysis involves looking at factors like trading volume and indicators such as the VIX (volatility index), which measures market expectations for near-term volatility. It’s also possible to interpret the positioning of traders in DJIA futures (expressed with the DJI ticker YM) via the CFTC Commitment of Traders report for insights into how various market participants are taking positions in the Dow. For instance, if the number of contracts held by non-commercials and speculators is positive, these participants are seen as bullish. Correlation Analysis Traders sometimes analyse correlations between the DJIA and other indices or assets. For example, the DJIA often moves alongside the S&P 500, but these correlations can shift based on economic or sector-specific developments. Through understanding these relationships, traders can anticipate how broader market trends might impact the Dow. Risks Associated with Trading the DJIA Trading the DJIA can be rewarding, but it comes with notable risks. One key risk is market volatility. Events like economic data releases, policy changes, or unexpected global events can cause sharp swings in the Dow’s value, creating opportunities but also increasing the chance of sudden losses. Another risk comes from leverage, especially with derivatives like CFDs. While leverage allows traders to control larger positions with less capital, it amplifies both returns and losses. Even a small adverse movement in the DJIA can lead to significant losses if leveraged positions aren’t managed carefully. Economic sensitivity is another factor. As the DJIA reflects the performance of large US companies, it’s highly sensitive to shifts in economic indicators like inflation and interest rates. A surprise rate hike or economic slowdown can affect the entire index, impacting all traders with positions in the DJIA. Finally, liquidity risks can arise, particularly in after-hours trading when market depth is thinner. This can lead to wider spreads and increased costs for those looking to enter or exit trades outside standard market hours. The Bottom Line The Dow Jones Industrial Average offers valuable insights and trading opportunities for those interested in the broader US economy. With a clear understanding of its components, influencing factors, and trading approaches, traders can navigate the DJIA trading confidently. Ready to get started with our low-cost, high-speed trading environment? Open an FXOpen account and explore DJIA CFDs on a platform built for traders at every level. FAQ What Is the Dow Jones Industrial Average? The Dow Jones meaning refers to a stock market index that tracks 30 large publicly traded companies in the United States. Known simply as "the Dow" and abbreviated to DJIA, it provides a quick view of the economic performance of some of the largest and most influential companies across various sectors. What Does the Dow Jones Measure? The DJIA measures the performance of 30 significant US companies, reflecting broader economic trends and investor sentiment. As a price-weighted index, stocks with higher share prices exert more influence on the Dow’s total value. How Many Stocks Are in the Dow Jones? There are 30 stocks in the DJIA, representing companies from diverse industries like technology, finance, and healthcare. What Is the Highest the Dow Jones Has Been? As of 7 November 2024, the highest Dow Jones ever was $43,823.10, marking a record peak for the index. Is the DJI Publicly Traded? The DJIA itself isn’t publicly traded, but traders can invest in its performance through ETFs, futures, and CFDs that track its value. This article represents the opinion of the Companies operating under the FXOpen brand only. It is not to be construed as an offer, solicitation, or recommendation with respect to products and services provided by the Companies operating under the FXOpen brand, nor is it to be considered financial adviceEducationby FXOpen119
us30 We start a new year with us30 the general trend is up and the goals are very big Please be patient Stay calm in the buying positions and make profits with every step or invest in the medium term as the market is still up I repeat my words the goals are medium and long term investment goals up to 48 thousandLongby Indicators1MGGROUP225
Price Targets 43,200 Amid Bullish Momentum Above 42,770Technical Analysis The price will try to touch 43200 while above 42770, so has a bullish momentum from 42770. Bearish confirmation will be established if the price stabilizes below 42,580. Key Levels: Pivot Point: 42770 Resistance Levels: 43210, 43350, 43650 Support Levels: 42770, 42580, 42390 Trend Outlook: Bullish Momentum: Stabilized above 42,910 Bearish Momentum: Stabilized below 42,770by SroshMayi116
Us30 longYearly entry 42000 Higher low Dollar weakness incoming Demand 2025 longLongby Master_Traders_MTA114
Us30 long42000 Mqp 50k tp for 2025 Higher lows Yearly open Dollar weakness incoming Longby Master_Traders_MTA113
US30 LONG ROCKET!!US30 is set for a large move up as the corrective Wave B will now start. Price target is 44000Longby Shivsaransh1113
US30 Bearish to Bullish Play for the Week So US30 hit a nice bullish Rally from the divergent bottom but we were not able to break through 35.400 even though we broke the 4hr daily yellow trendline to the upside. We broke back into bearish territory Friday before close. So now I am looking at a weekly consolidation candle from last week giving me a projection for another possible consolidation week starting with a drop to the 42.450 area then I expect bulls to come In ultimately pushing price higher breaking through our 1st major resistance 34.400 into our 2nd major resistance 35.550, if we manage to break through both expect a bullish Rally into our next Major Resistance at 44.450. This week could close as another doji consolidation week if so I’m holding bottom buy entry to swing exits. I’m looking for a higher low this week giving us a wick on this weekly candle, I have a sell limit placed (shown on chart) and will possibly put a buy limit at the target price. FULL BEARISH SCENARIO: If we manage to break through 42.440 in a major way expect 42.250 next and a full break through that level would go to next major support zones at 41.900 & 41.650 May the pips be in our favor. by jcatchinpips112
DOW JONES: Rare Channel Up bottom buy opportunityDow Jones remains bearish on its 1D technical outlook (RSI = 40.772, MACD = -242.050, ADX = 47.872) as despite trading on the 1D MA100, it has failed yet to recover the 1D MA50. Technically though, the price action is sitting exactly at the bottom of the long term Channel Up and the 1D RSI has formed a bottom fractal identical to those of June and April 2024. The minimum target on those has been +7.65% but since we have the R1 level to consider as Resistance, that will be our target (TP = 45,000). ## If you like our free content follow our profile to get more daily ideas. ## ## Comments and likes are greatly appreciated. ##Longby InvestingScope11
US30 Bullish Trade of the Week So US30 hit our buy zone yesterday even though it didn’t trigger our sell limit beforehand we did have a buy limit set up at 42.440 and we are currently riding that but will look to take profits shortly because I do see another push back into the 42.440-42.250 area before pushing back up. I will get some nice entries in that price action by following the 5-15 min candles once in our kill zone and placing a buy stop above the last 2nd closed candle (either 5-15) and trailing. If it continues below 42.250 buy stop will be eliminated.. as sellers take over. BUT until then we see bulls coming in heavy in that area.Longby jcatchinpips6
DJIA H4 | Falling to swing-low supportDJIA (US30) is falling towards a swing-low support and could potentially bounce off this level to climb higher. Buy entry is at 42,153.14 which is a swing-low support. Stop loss is at 41,650.00 which is a level that sits under the 127.2% Fibonacci extension and a swing-low support. Take profit is at 43,042.34 which is an overlap resistance. High Risk Investment Warning Trading Forex/CFDs on margin carries a high level of risk and may not be suitable for all investors. Leverage can work against you. Stratos Markets Limited (www.fxcm.com): CFDs are complex instruments and come with a high risk of losing money rapidly due to leverage. 64% of retail investor accounts lose money when trading CFDs with this provider. You should consider whether you understand how CFDs work and whether you can afford to take the high risk of losing your money. Stratos Europe Ltd (www.fxcm.com): CFDs are complex instruments and come with a high risk of losing money rapidly due to leverage. 66% of retail investor accounts lose money when trading CFDs with this provider. You should consider whether you understand how CFDs work and whether you can afford to take the high risk of losing your money. Stratos Trading Pty. Limited (www.fxcm.com): Trading FX/CFDs carries significant risks. FXCM AU (AFSL 309763), please read the Financial Services Guide, Product Disclosure Statement, Target Market Determination and Terms of Business at www.fxcm.com Stratos Global LLC (www.fxcm.com): Losses can exceed deposits. Please be advised that the information presented on TradingView is provided to FXCM (‘Company’, ‘we’) by a third-party provider (‘TFA Global Pte Ltd’). Please be reminded that you are solely responsible for the trading decisions on your account. There is a very high degree of risk involved in trading. Any information and/or content is intended entirely for research, educational and informational purposes only and does not constitute investment or consultation advice or investment strategy. The information is not tailored to the investment needs of any specific person and therefore does not involve a consideration of any of the investment objectives, financial situation or needs of any viewer that may receive it. Kindly also note that past performance is not a reliable indicator of future results. Actual results may differ materially from those anticipated in forward-looking or past performance statements. We assume no liability as to the accuracy or completeness of any of the information and/or content provided herein and the Company cannot be held responsible for any omission, mistake nor for any loss or damage including without limitation to any loss of profit which may arise from reliance on any information supplied by TFA Global Pte Ltd. The speaker(s) is neither an employee, agent nor representative of FXCM and is therefore acting independently. The opinions given are their own, constitute general market commentary, and do not constitute the opinion or advice of FXCM or any form of personal or investment advice. FXCM neither endorses nor guarantees offerings of third party speakers, nor is FXCM responsible for the content, veracity or opinions of third-party speakers, presenters or participants.Longby FXCM5
Dow Jones, 12M analysisHi, a very Happy new year to all, posing my another 12M analysis will post some additional information in the comment section shortly including 12M levels by omvats16
US30 BULLISH SWING IDEA So US30 hit a beautiful double bottom creating a 4HR Divergence pushing price back up 1st breaking a 1hr trendline propelling it all the way back up from the news drop now we’re slowly making higher lows looking like we will break to the upside BUT keep in mind Bearish scenario #2 (drawn in RED) is possible since we still are under the daily/weekly trendline/resistance level in Bearish territory UNTIL we break 43.400 to the upside.. if that happens expect a beautiful Bullish Rally going into January.. May the markets be on our side !!Longby jcatchinpips444
US30 possible forecast and update Following japans take on buyside LQ we can see a resistance level made and this market looking for more bearish momentum. I can see this market chasing Daily sellside LQ marked with white line exactly where arrow path is drawn too then buying up from there. id like to see a taken 4hr buyside LQ before to confirm. maybe not this market but maybe spx,nas,ger40,or japan225 to show a 4hr buysidle LQ to confirm sell. Shortby DgenJoe_0076
Accumulation - price moving from Support to ResistancePrice seems to have broken out of an ascending channel Forming a range just below our price channel Currently price is pulling away from support heading for resistance levelsLongby Mlando174
US100, I like this if we make FVG to IFVG , i think we go higher until Buyside Liquidity! we need just close above FVG!Longby AlgoTrading-Kavannasri4
Mastering the trading on US 30 (Part 2)Hi and Merry Christmas to you and your families )) ** This idea is the continuation of the previous idea (Mastering the trading on US 30) ** It will go to the purple uptrend line which was not broken since 23.10.2023 as TP1 ** High chance will go to my Fib retracement level in orange colour for TP2 then to retrace to the purple line up again. ** The index had fallen from the rising channel in yellow lines and had lost already to do 3rd HL ** We are ,by not hitting the 3rd HL, in a long term bearish wave regardless any bullish retrace up except if the index will go to TP1 and retrace up from without closing the day candle on its right. ** If the day candle will close down to the purple line, I will set another idea for US 30 and will be expected further downside moves. My ideas are exclusive to myself only and is not regarded as an advice for traders or investors and are not more than personal thoughts which I just wanted to share with you all and I do hope they could help. I am not selling any signals and I do not take money favour any trades recommendations. They are free of charge all lifelong but I keep the copy rights of them though to not be copied or shared or sold. Shortby moustafa_mareiUpdated 3314
US30USD H1 AnalysisTechnical Analysis: The US30USD is showing a clear resistance area around 43,250, with previous price action confirming this level. The support area is identified at 42,350. A strong bearish pattern has emerged with the recent rejection from the resistance zone. Entry: Current price level Stop Loss (SL): Set at 43,250 to limit potential losses above resistance. Take Profit (TP): Targeting 42,350 aligning with support levels. Fundamental Analysis: Factors influencing this trade include upcoming economic data releases and overall market sentiment reflecting investor caution amid current macroeconomic uncertainties. Continued monitoring of news events that could impact market dynamics is recommended. This setup offers a favorable risk-reward ratio by capitalizing on anticipated downward momentum within established technical levels. Note: This analysis is for educational purposes and not trading advice. Consider market conditions and strategies. Please do not forget the like button, Share it with your friends,thanks, and Trade safe. Shortby David_Josh_Trader3
BEarish drop?Dow Jones (US30) is reacting off the pivot and could drop to the pullback support. Pivot: 43,358.90 1st Support: 41,883.16 1st Resistance: 44,074.83 Risk Warning: Trading Forex and CFDs carries a high level of risk to your capital and you should only trade with money you can afford to lose. Trading Forex and CFDs may not be suitable for all investors, so please ensure that you fully understand the risks involved and seek independent advice if necessary. Disclaimer: The above opinions given constitute general market commentary, and do not constitute the opinion or advice of IC Markets or any form of personal or investment advice. Any opinions, news, research, analyses, prices, other information, or links to third-party sites contained on this website are provided on an "as-is" basis, are intended only to be informative, is not an advice nor a recommendation, nor research, or a record of our trading prices, or an offer of, or solicitation for a transaction in any financial instrument and thus should not be treated as such. The information provided does not involve any specific investment objectives, financial situation and needs of any specific person who may receive it. Please be aware, that past performance is not a reliable indicator of future performance and/or results. Past Performance or Forward-looking scenarios based upon the reasonable beliefs of the third-party provider are not a guarantee of future performance. Actual results may differ materially from those anticipated in forward-looking or past performance statements. IC Markets makes no representation or warranty and assumes no liability as to the accuracy or completeness of the information provided, nor any loss arising from any investment based on a recommendation, forecast or any information supplied by any third-party.Shortby ICmarkets3