Hanzo / US30 15m Path ( Confirmed Breakout Zones )🆚 US30
The Path of Precision – Hanzo’s Market Strike
🔥 Key Levels & Breakout Strategy – 15M TF
☄️ Bearish Setup After Break Out – 41750 Zone
Price must break liquidity with high volume to confirm the move.
☄️ Bullish Setup After Break Out – 41950 Zone
Price must break liquidity with high volume to confirm the move.
🩸 15M Time Frame Confluence
————
CHoCH & Liquidity Grab @ 41820
Key Level / Equal lows Formation - 41600
Strong Rejection from 42000 – The Ultimate Pivot
Strong Rejection from 41450 – The Ultimate Pivot
🔥 1H Time Frame Confirmation
Twin Wicks @ 41750 – Liquidity Engineered
Twin Wicks @ 41450 – Liquidity Engineered
US30 trade ideas

US30 - LONGPrice had the big drop as expected. Didn't quite fill the gap that I thought it would. But seeing that price has now changed momentum on the higher time frames, I am expecting it to continue to rise and create a higher high.
Support and resistance bosAfter support or resistance the market will sweep liquidity and create the first bos .the market will return to the bos with immediate effect to push the price up or down

US30... theory to take out the gapAs the high hit the resistance level early yesterday and the pattern ( Head and Shoulders ) formed more today on the HTF, I think the best way to close the gap will be a complete Head and Shoulder pattern.

One of my FAVOURITE ENTRY MODELS!!!!AMD is one of my favourite ways to get into the market. Tom Camp, my mentor, has taught me this. Accumulation, Manipulation, and Distribution is known as AMD which is a certain movement in price with in a range. When price Accumulates it consolidates, engineering liquidity on both sides of the market. When price Manipulates it targets either buy-side or sell-side liquidity first then it will target the buyside or sell-side liquidity. Meaning if you're in a bullish environment and price pulls into a HTF POI on a LTF price displays AMD where it will target buy-side liquidity first then target sell-side liquidity and price will reverse. When price distributes it retraces back into the range created in the Manipulation phase. Normally Manipulation phase price displaces or there is an inverse FVG or FVG or OB you can enter off of.

sell US30📉 Technical Indicators
As of May 22, 2025, at 1:05 PM GMT, the Dow Jones 30 Futures show the following:
Investing.com
Price: 41,880.00 USD
Technical Summary: Strong Sell
Moving Averages: Strong Sell (12 out of 12 indicators)
Technical Indicators: Strong Sell (7 out of 7 indicators)
Investing.com
+1
TradingView
+1
Key indicators include:
RSI (14): 31.72 (approaching oversold territory)
MACD (12,26): -151.76 (bearish)
CCI (14): -260.43 (oversold)
Williams %R: -0.503 (overbought)
Stochastic RSI (14): 100 (overbought)
FastBull
+5
Investing.com
+5
TradingView
+5
🔍 Footprint Chart Insights
Footprint charts, which display executed buy and sell orders at specific price levels, are valuable for assessing market sentiment. Currently, the charts indicate:
Optimus Futures
+1
Wikipedia
+1
Investing.com
Sell Imbalances: Higher volume of sell orders at key price levels, suggesting strong selling pressure.
Point of Control (POC): Located at lower price levels, indicating that the majority of trading volume is occurring at these prices, reinforcing the bearish sentiment.
Lack of Buy Imbalances: Minimal indications of strong buying interest at current levels.
📊 Market Sentiment
Recent analyses from trading communities suggest a bearish outlook for US30. For instance, a TradingView analysis notes that US30 is reacting from a strong demand zone (42,400 - 42,500), showing a possible reversal after a liquidity grab below recent lows. However, the overall trend remains bearish, and traders are advised to watch price action closely and confirm momentum before entering.
TradingView
+1
TradingView
+1
TradingView
✅ Conclusion
Given the prevailing technical indicators and order flow data, the US30 is currently in a bearish phase. Traders should exercise caution and consider waiting for clear signs of reversal or stabilization before entering long positions. Monitoring key support levels and staying updated with market news will be crucial in the coming days.
For a visual understanding of US30 order flow trading, you might find this video insightful:

US30/Dow Jones Trade IdeaThis is what I believe could be cooking up currently on US30... A possible buyers control might be coming up the coming days as it looks like price is possibly heading for HTF FVG.
Remember this is just a trade idea and nothing is completely guaranteed to play out the way I'm anticipating... Following this trade idea will be on your own risk!
#us30 #dowjones #indices #nasdaq #german30 #dax

DOW JONES INDEX (US30): Your Plan to Buy Explained
There is a high chance that US30 will resume growth soon.
The index is currently testing a wide daily support cluster.
My signal to buy will be a bullish violation and a candle close above
41920 minor horizontal resistance.
A bullish movement will be anticipated at least to 42200 level then.
❤️Please, support my work with like, thank you!❤️
I am part of Trade Nation's Influencer program and receive a monthly fee for using their TradingView charts in my analysis.

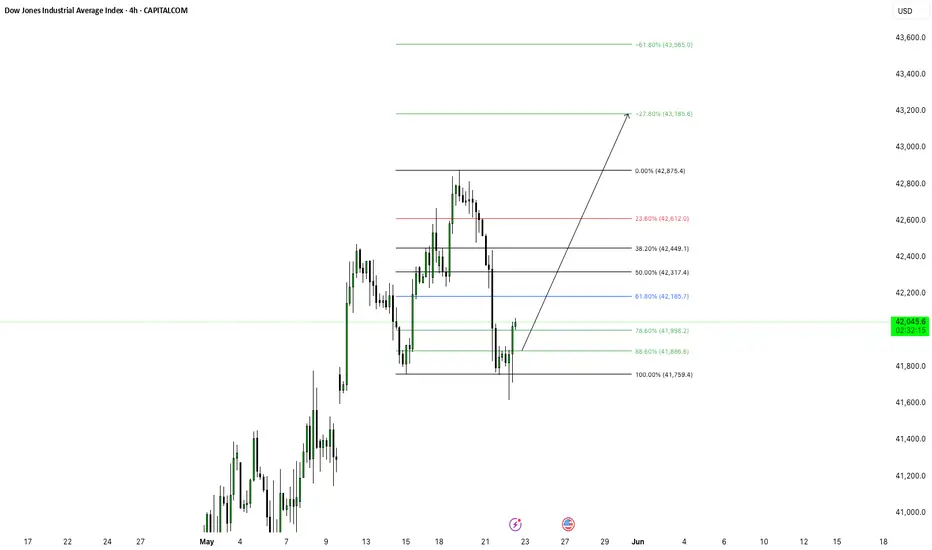
Dow Jones Short Term Sell Trading PlanM15 - Strong bearish momentum
Lower lows on the moving averages of the MACD indicator.
Until the two Fibonacci resistance zones hold I expect the price to continue lower further.
If you enjoy this idea, don’t forget to LIKE 👍, FOLLOW ✅, SHARE 🙌, and COMMENT ✍! Drop your thoughts and charts below to keep the discussion going. Your support helps keep this content free and reach more people! 🚀
--------------------------------------------------------------------------------------------------------------------
Disclosure: I am part of Trade Nation's Influencer program and receive a monthly fee for using their TradingView charts in my analysis.

US30 Locked & Loaded – Get In, Get Profit, Get Out!**💰 Market Heist Alert: US30 Setup 🔥**
Yo Money Raiders & Chart Bandits! 🏴☠️📈
US30 is ripe for the taking, and we’re rollin’ in with the *Thief Trading Style*—a slick mix of sniper-level technicals and street-smart fundamentals. Whether it’s bull or bear, we strike fast, grab profit, and vanish! 💨💸
---
**🧠 The Blueprint – US30 Hit Plan**
**📍 Entry Zones:**
🔹 **Bullish Strike 1**: Look for a pullback and **buy at 42400** – clean signal to enter the action!
🔹 **Bullish Strike 2**: Set your sights on **40900 - 40800**, inside the Institutional Buy Zone. Wait for an MA pullback, then hit it hard. Fortune favors the bold! ⚔️
🔹 **Bearish Ambush**: If price breaks down below **41600**, it’s time to ride that bear wave 🐻💨
💡 **Pro Bandit Tip**: Set alerts on key levels so you never miss the moment! 🔔
---
**🛑 Stop Loss Defense:**
Protect the stash! Use the **nearest 4H low** as your SL for day/swing trades.
Tweak based on your risk level, lot size, and open positions. 🛡️
---
**🎯 Profit Targets – Take the Loot:**
💥 **Bullish Goal**: Lock in at **44200** – or escape early if momentum cools 😎
💥 **Bearish Goal**: Target **40600** – but don’t overstay if signs reverse 🚪
🚨 Watch out for overbought/oversold traps – this is where many fall.
---
**⚠️ Risk Alert – News Incoming!**
News events = wild moves. Handle with care:
📰 Avoid new entries during major news drops
📉 Use **trailing SL** to secure profits and manage risk like a pro
Stay smart. Stay ready. This is a heist, not a gamble! 💼💣
---
**🚀 Boost the Thief Trading Movement!**
If this setup hits your style, smash that **boost** and show love to the Thief Crew! 💪
We raid charts daily with precision, profit, and a bit of outlaw swagger. Let’s own the US30 together! 🤝💵
Stay sharp, alerts on, and eyes wide—more setups coming soon.
Catch you in the green, bandits! 🤑🎉📊

Taking a long trade on u30Reason I'm taking long on this trade is because I see a confirmation on my W FORMATION and a a nice rejection hammer to lock for bulls to enter the market

US30 (Dow Jones) Update – May 22, 2025 📉 US30 (Dow Jones) Update – May 22, 2025 ⚠️
Massive Breakdown Below 42,000 – Momentum Shift in Full Effect 🧨
🔎 Market Breakdown:
📉 Current Price: 41,803
💥 Major Support Lost: 42,000 ➡️ retested + rejected
🧵 Bearish structure confirmed – lower highs + breakdown of prior higher low
📉 9/21 EMAs sharply angled down, widening = increasing downside momentum
We're now back below key structure from early May, and that 41,770 zone is hanging by a thread. Volume uptick adds weight to the downside move 🔻
📊 Key Levels:
🧱 Immediate Support: 41,770
🔻 If that breaks → next target: 40,700, then 39,775
🔼 Resistance now flips to 42,000 and 42,300
🔥 Trade Outlook:
Bearish bias 🟥:
Below 42,000 = continuation expected
Any bounces into 41,900–42,000 may offer sell setups
Watch for clean break & close below 41,770 for acceleration
Bull case invalid unless:
Price reclaims 42,000 and flips it into solid support with volume ✅
🧠 Smart Money Take:
This is a classic supply re-entry zone. Buyers failed to hold higher structure and are now trapped → liquidity likely fueling this sell-off 📉
Don’t counter-trend guess too early! Wait for reclaim signals.


US30 SMC/ICT Plan – Waiting for Pullback Short OpportunityIdea/Scenario:
Expecting a pullback to the 42,100–42,200 zone after a strong bearish move.
Looking for bearish confirmation (price action or rejection) in that area for a potential short entry.
Main target: 41,650–41,600, possibly lower toward 41,000.
Bias remains bearish below 42,200.

US30 Potential Bullish ContinuationHi there,
US30 appears bullish on the H2 timeframe, but I am anticipating a dip before the bullish continuation.
The price broke above the significant high of 40,860.28 and formed a low, creating a relative bullish wave toward the high of 42,473.33. This low is significant and remains open for a future revisit.
The potential resistance level is 42,949.85, with a market bias toward 43,528.16.
Happy Trading,
K.
Not a trading advice,

DOW/US30 - PERFECT TIME FOR LONG ENTRYTeam, i hope you all making millions on SHORT BOTH SETUP UK100 AND GER30 today
However there is no perfect time to entry LONG DOW/US30 now
please follow the guideline and entry..
target 1st is 150-200 points
2nd target between 300-500 points.
we expect this swing will take tomorrow and next day for the recovery.

US30 - SHORTPrice has broken key levels and its strong bullish trend. I believe we will continue the sell off and fill the gap.
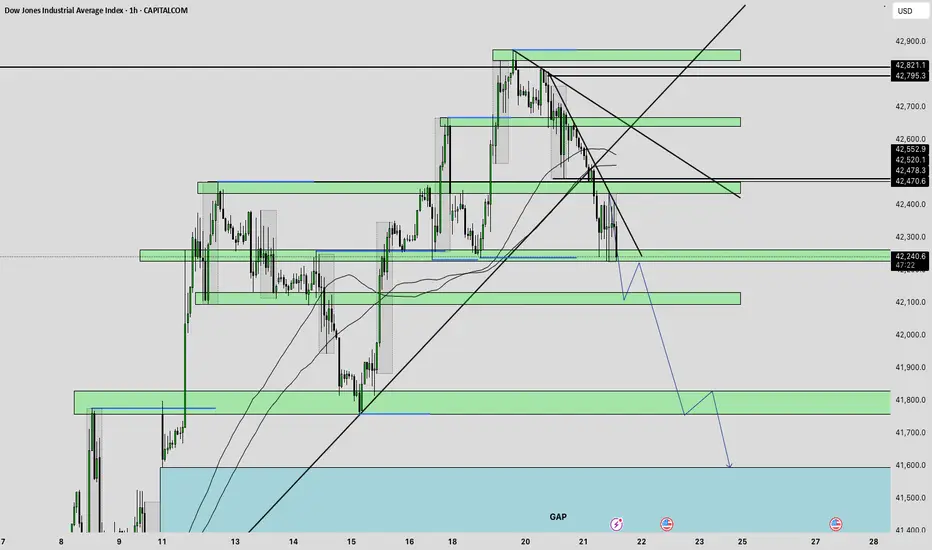
sell US30 / US30 Analysis – 60MPrice has retested the VAL (Value Area Low) after breaking down from the volume structure.
VAL: price retested and showed weakness
📌 A failure to reclaim the POC may lead to a drop toward the next demand zone at 42,160–42,000.
Volume profile shows a clear shift in control to sellers. Reclaim of POC = possible bullish shift. Hold below = continuation lower.

Us longGoing long because the market is at a major supply level & price action showung reversal patterns

Signs of Selling Pressure (Absorption of Buys at Highs)🧠 Quick Terminology Refresher:
Absorption = Large volume hitting the book with little price movement (strong limit orders halting progress).
Exhaustion = Declining volume near highs/lows, indicating a potential reversal or lack of continuation.
Delta = Net buying/selling pressure (positive = aggressive buyers, negative = aggressive sellers).
Imbalance zones = Strong activity favoring one side of the market — high-probability interest areas.
🔎 Breakdown of Key Zones (Right Side of the Chart – May 20–21):
🔴 Signs of Selling Pressure (Absorption of Buys at Highs)
May 20 Candle:
Delta: -1.37K on 80.27K volume = net sellers present.
Upper wick shows buy volume at the highs being absorbed by resting sell orders.
Price fails to close above 42,300, the same level it touched multiple times (look left), reinforcing it as resistance.
The cluster of buying at the highs followed by price dropping suggests buying exhaustion + absorption by sellers.
🔻 May 21 Candle (Early):
Delta: -387 on low volume (21.68K) — early in the session.
Low delta but presence of symmetric buy/sell volume suggests a balance day or low conviction.
However, failure to break back above the previous POC zone (around 42,200–42,300) + no aggressive buying continuation = bearish bias.
🔵 Prior Bullish Activity (May 15–19):
May 15: Strong positive delta (+3.84K) with 99.68K total volume — clear initiative buy pressure.
May 16–19: Successive candles show diminishing delta and heavy total volume with:
Imbalance blocks shifting down.
Lower highs and failed follow-through after May 15 = exhaustion of buyers.
Especially May 19: delta of -1.14K, and large wick + failed upside = absorbed buys, followed by rejection.
🧱 High-Volume Nodes (Support/Resistance):
Resistance Zone: 42,270–42,300
Multiple failed closes above, heavy sell volume absorbed buyers.
Support Zone: 42,000–42,100
Yellow highlight zone — recent volume nodes + last remaining absorption candle May 14–15.
But current candles are testing this zone, and not bouncing with strength.
📉 Conclusion: Sell Bias Based on Footprint Behavior
✅ Reasons to Lean Bearish / Sell:
Absorption at highs (May 19–20).
Exhaustion of buying delta after May 15–16.
Lower highs and lower volume follow-through.
Price failing at POC/resistance zones (42,300) repeatedly.
No new aggressive buying footprints in current bars.
⚠️ Not a Blind Sell – Wait For:
Break and hold below 42,100, ideally confirmed by:
Negative delta + rising total volume.
Sell imbalances near lower levels.
Signs of no strong passive buyer absorption at 42,000.
🛠 Suggested Strategy:
📉 Short Bias: Target zone: 41,850–41,900
📈 If price reclaims 42,300 with positive delta spike, exit shorts or flip long (failed breakdown = trap).
🎯 Watch Volume Profile: Large nodes mean congestion — avoid taking new trades in the middle of these zones.

Dow Jones INTRADAY supported at 41900Geopolitical Risk: Oil prices spiked after CNN reported Israel may strike Iran’s nuclear sites, increasing market uncertainty. No final decision confirmed yet.
Rising geopolitical tension could weigh on risk sentiment and equities.
Safe-Haven Moves: The Swiss franc and Japanese yen strengthened as investors moved to safety. Reflects cautious tone in global markets, possibly limiting upside for equities.
Morgan Stanley View: Strategists recommend “Buy America” – but not the US dollar, hinting at confidence in US assets (e.g., stocks), while expecting further USD weakness.
Bond Market Shift: Traders expect long-term US bond yields to rise, which could pressure tech and growth stocks in equity indexes like the Nasdaq.
UK Inflation Watch: UK inflation data expected to tick higher — adding to global inflation and rate hike concerns, which may influence market mood.
Trading Outlook:
US equity indexes may open mixed to cautious. Geopolitical risks and rising yields could create headwinds, especially for rate-sensitive sectors. Watch for oil-driven inflation fears, bond yield movements, and shifts in safe-haven flows.
Key Support and Resistance Levels
Resistance Level 1: 42950
Resistance Level 2: 43370
Resistance Level 3: 43630
Support Level 1: 41900
Support Level 2: 41500
Support Level 3: 41200
This communication is for informational purposes only and should not be viewed as any form of recommendation as to a particular course of action or as investment advice. It is not intended as an offer or solicitation for the purchase or sale of any financial instrument or as an official confirmation of any transaction. Opinions, estimates and assumptions expressed herein are made as of the date of this communication and are subject to change without notice. This communication has been prepared based upon information, including market prices, data and other information, believed to be reliable; however, Trade Nation does not warrant its completeness or accuracy. All market prices and market data contained in or attached to this communication are indicative and subject to change without notice.


check the trendAccording to the behavior of the index in the green support range, possible scenarios have been identified.
As long as the index fluctuates above the red support range, the continuation of the upward trend will be likely.
