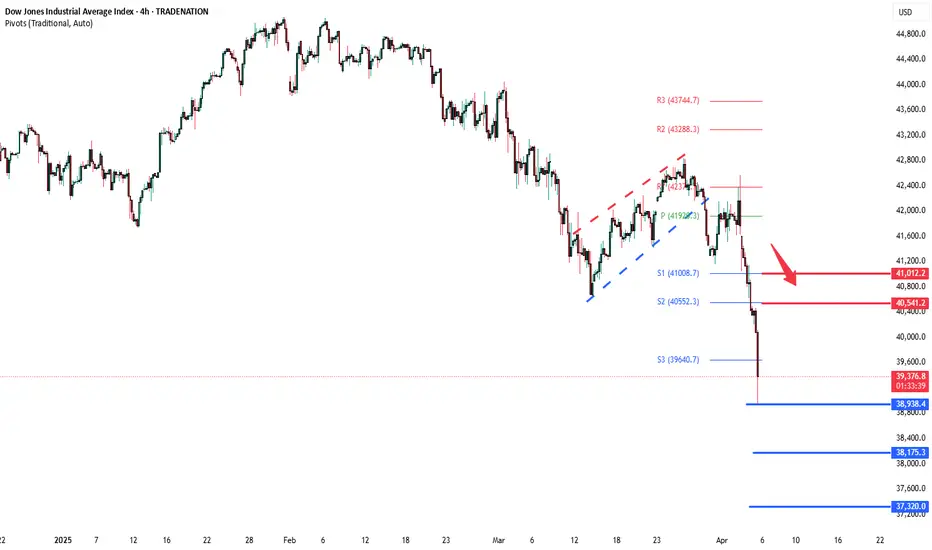
Dow Jones INTRADAY key trading levels ahead of US employmentKey Support and Resistance Levels
Resistance Level 1: 40540
Resistance Level 2: 41000
Resistance Level 3: 42000
Support Level 1: 38940
Support Level 2: 38175
Support Level 3: 37320
This communication is for informational purposes only and should not be viewed as any form of recommendation as to a particular course of action or as investment advice. It is not intended as an offer or solicitation for the purchase or sale of any financial instrument or as an official confirmation of any transaction. Opinions, estimates and assumptions expressed herein are made as of the date of this communication and are subject to change without notice. This communication has been prepared based upon information, including market prices, data and other information, believed to be reliable; however, Trade Nation does not warrant its completeness or accuracy. All market prices and market data contained in or attached to this communication are indicative and subject to change without notice.
US30 trade ideas
Wall Street - Printing a very Dangerous Move!The Dow Jones (US30) is currently testing a critical level within its long-term ascending channel. The next move depends on whether the price holds or breaks this structure.
🔹 Possible Scenarios:
1️⃣ Bullish Bounce (Channel Holds) ✅
If price finds support within the 38,000 - 36,000 zone, we could see a strong rebound.
A bounce from this level may lead to a retest of 42,000 - 44,000, with potential for another attempt at the upper channel near 46,000+.
Confirmation: Look for bullish price action like long wicks or a bullish engulfing candle.
2️⃣ Bearish Breakdown (Channel Breaks) ❌
If the price breaks below the channel and closes under 36,000, this could signal a trend shift.
A breakdown may accelerate selling, leading to further downside targets at 32,000, then 28,000.
Confirmation: A strong weekly close below support with increased volume and no immediate recovery.
📌 Key Takeaway:
Channel intact → Buy dips for potential continuation.
Channel break → Expect deeper correction towards long-term supports.
Let me know your thoughts! Are you bullish or bearish on US30? 🚀📉
If you found this analysis valuable, kindly consider boosting and following for more updates.
Disclaimer: This content is intended for educational purposes only and does not constitute financial advice.

Repeat of covid manipulation - sells to 34000 on US30.Breakdown of where US30 could be heading in the short team but also the long term.

US30 new update, bearish at allhi mates, I'm here with something new. US30 4h timeframe. i think its still bearish, what's your opinion. lets talk about it

No Signs of the Bull ArmyDow Jones Update : The correction appears likely to continue, testing the 40,045–40,467 range. Subsequently, the index is expected to rebound toward the 40,714–40,945.
Additionally, it is worth noting the gap in the 41,173–41,629 range—perhaps the market may find its way there.

US30 - Correction was Predicted in Nov 2024This correction was predicted in Nov 2024 when markets were booming.
We still have room for deeper correction before a pullback.

DOW JONES INDEX (US30): Detailed Support & Resistance Analysis
Here is my latest structure analysis for US30 Index.
Resistance 1: 40650 - 40850 area
Resistance 2: 41150 - 41300 area
Resistance 3: 42550 - 42850 area
Support 1: 40000 - 40250 area
Support 2: 39470 - 39650 area
Support 3: 38400 - 38650 area
Consider these structures for pullback/breakout trading.
❤️Please, support my work with like, thank you!❤️
I am part of Trade Nation's Influencer program and receive a monthly fee for using their TradingView charts in my analysis.

US30 Trade Update – 04/04/2025🚨 US30 Trade Update – 04/04/2025 🚨
📉 US30 Sell-Off Intensifies!
The Dow Jones has now broken below 41,000 and is approaching the critical support at 40,063. Bears are in full control, and if this level fails, we could see a test of 39,279 next.
🔍 Key Observations:
✅ Major rejection at 42,359 resistance
✅ Strong bearish momentum breaking 41,000
🔻 Next Major Support: 40,063 → 39,279
🎯 Trade Plan:
🔹 Short below 40,063 → Target 39,279
🔹 Look for bounce signs at 40,063 for potential reversal
🔹 Long only if price reclaims 40,600+
⚠️ Watch for a reaction at 40,063—this level could determine the next major move.

check the trendIt is expected that the trend will change within the current support area and we will see the beginning of the upward trend. Otherwise, the continuation of the downward trend is likely with the breakdown of the current support area.

Warning Signs Flashing: Dow Jones Breaks Key SupportThe Dow Jones Index has officially broken its rising trendline support, signaling a possible shift in the medium-term trend. After losing this key ascending structure, price is now hovering near the psychological support zone of 40,000, which has historically acted as both resistance and support.
This level is crucial. If it holds, we could see a temporary bounce or consolidation. However, if the 40K zone fails to provide support, the index may head toward the next major support area around 38,000, aligned with the longer-term trendline support.
Do like and follow us
THANK YOU

Trade Idea : US30 Short ( MARKET )Technical Analysis Overview:
1. Daily Chart:
• The index is in a clear downtrend, with price action breaking below the moving average.
• MACD is deeply negative, with a bearish divergence and downward momentum.
• RSI at 37.28, indicating approaching oversold territory, but not yet reversing.
2. 15-Minute Chart:
• Strong downward momentum with sharp drop visible.
• MACD is heavily negative, confirming bearish momentum.
• RSI is at 32.71, indicating oversold conditions, but no clear sign of reversal yet.
3. 3-Minute Chart:
• Sharp sell-off followed by consolidation.
• MACD is negative but appears to be flattening, suggesting potential for a short-term bounce or continued consolidation before the next move.
• RSI at 44.38, showing mild recovery from previous lows but still below the midpoint (50).
Trade Idea:
• Position: Short (Sell)
• Entry Level: 41,250 (near minor resistance or after a weak bullish retracement)
• Stop Loss (SL): 41,800 (Above recent consolidation zone or resistance)
• Take Profit (TP): 40,400 (Previous support area with good potential for price to test)
FUSIONMARKETS:US30

US30 - Long (Update)Price has now broken further than anticipated. We have a strong daily s/r level that price is approaching. Once we have reached this level. We will start looking for confirmation to the upside.

Do Or Die!The past few weeks have caught out many bulls as Trump tariffs wreck the markets.
41K support today may just be the bottom, this area must hold, otherwise we are heading not just for a correction but a bear market.
The falls have been consistent and steady, no real plunges which points to a correction, although we do have a double top from the Dec highs and early Feb highs.
Gold and silver have been the standout performers, 3000 gold will be blown away.
A mix of Trump threats of tariffs and many beginning to wake up to media attention in PM's....a hedge against turmoil.
Any close below the Dow low is a short, from here bottom fishing just may produce a rally of significance, perhaps a rally to sell.
Appreciate a thumbs up and God Bless you all!

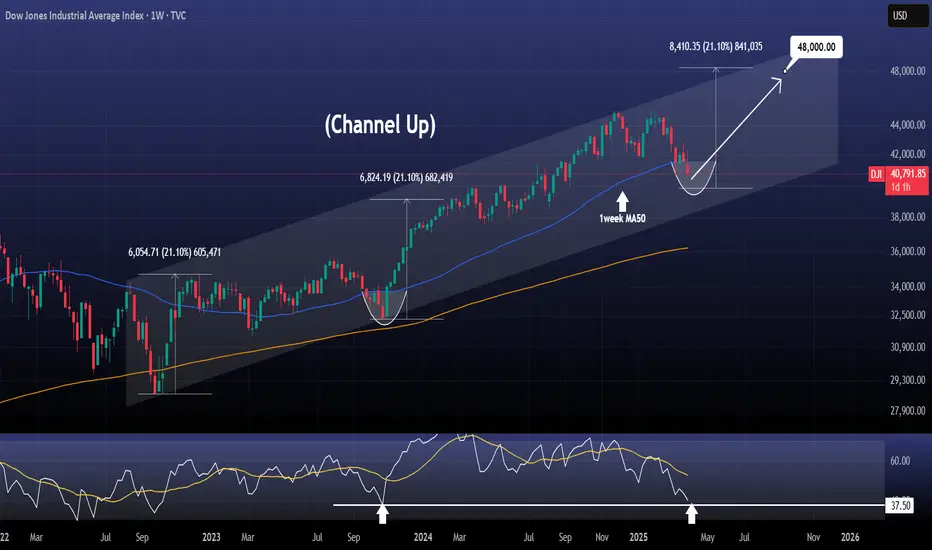
DOW JONES You will regret not taking this buyDow Jones / US30 remains under heavy selling pressure as it has been yet again rejected under the 1week MA50, failing to hold the closings over it of the past 3 candles.
This is the strongest correction of the index since the September 26th 2022 bottom and the start of the Channel Up.
Despite the negatives, the 1week RSI is almost on the 37.50 level, which is where the last higher low of the Channel Up was formed on October 23rd 2023, again under the 1week MA50.
Obviously even though the downside may continue for a few more days, the extent is limited technically, especially since the worst of the tariffs have been priced and only new and more aggressive ones can inflict more non-technical fear on the market.
This is a unique long term buy opportunity, the likes of which saw 2 rallies before of +21.10%.
Even in the event of one more dip, a 48000 target towards the end of the year is very realistic.
Follow us, like the idea and leave a comment below!!
US30 - LongAfter yesterday's news, price has now dumped and retesting lows from a few weeks ago. We will wait to see if buyers can come back in the market and push price back up to fill the gap.


US30 Weekly Analysis 3.31-4.3Push to the upside today but overall still see us30 bearish and could potentially hit 41000 and even 40750.
Price is below our 4 hr MAs and still below our key levels and trend line on the higher time frame.

Dow Jones INTRADAY bearish below 42375Key Support and Resistance Levels
Resistance Level 1: 42375
Resistance Level 2: 42846
Resistance Level 3: 43288
Support Level 1: 40560
Support Level 2: 40000
Support Level 3: 39637
This communication is for informational purposes only and should not be viewed as any form of recommendation as to a particular course of action or as investment advice. It is not intended as an offer or solicitation for the purchase or sale of any financial instrument or as an official confirmation of any transaction. Opinions, estimates and assumptions expressed herein are made as of the date of this communication and are subject to change without notice. This communication has been prepared based upon information, including market prices, data and other information, believed to be reliable; however, Trade Nation does not warrant its completeness or accuracy. All market prices and market data contained in or attached to this communication are indicative and subject to change without notice.

1-week US30: Could the Dow Jones Drop another 2000 PointsWe’re analyzing the weekly chart to grasp the broader market trend. Over the past three years, the US30 index has surged by 17,000 points, often resembling a nearly straight upward trajectory. However, multiple technical and fundamental factors now suggest a potential downward correction.
From a fundamental standpoint, increasing tariffs imposed by the U.S. administration are fueling investor uncertainty, prompting a market sell-off. The prevailing risk-off sentiment is pushing investors away from stocks and into traditional safe-haven assets like the Japanese Yen and Gold.
From a technical perspective, the US30 has formed a double top pattern, a classic bearish signal. Additionally, the 23% Fibonacci retracement level, which initially acted as support, has failed, with prices now breaking below.
Given this setup, we are initiating a direct sell order at 41,000, with a stop-loss (SL) 2% above this level. Our take-profit (TP) target is set at 39,000, aligning with the 38% Fibonacci retracement level, which historically serves as strong support.
This strategic positioning reflects the heightened volatility and the likelihood of a further market decline in the short to mid-term.

US30 Testing Major Demand Zone – Reversal Incoming?🔎 Market Overview:
The Dow Jones Industrial Average (US30) has dropped into a strong demand zone (41,200 - 41,350), which has historically acted as a major support area. Will buyers step in for a rebound, or will we see further decline?
🔹 Key Resistance Levels: 41,932 | 42,605
🔹 Current Price: 41,234
🔹 Key Support Levels: 41,347 (demand zone) | 41,200
📉 Recent Price Action:
1️⃣ Strong Sell-Off into Demand Zone:
After testing resistance at 41,932, US30 faced heavy selling pressure.
Price has now entered a high-volume support area (41,200 - 41,350).
2️⃣ Potential Reversal Setup:
If buyers hold this zone, we could see a bullish push back to 41,932 (first resistance).
A breakout above 41,932 could open the door for a move to 42,600+.
3️⃣ Breakdown Scenario:
If 41,200 breaks, expect further downside towards 40,800 - 40,500.
This would confirm a bearish continuation pattern.
📊 Trade Plan:
📍 Bullish Setup:
🔹 Look for bullish confirmation in the 41,200 - 41,350 zone.
🔹 A strong bounce could provide an entry targeting 41,932 and 42,600.
📍 Bearish Setup:
🔹 If price fails to hold 41,200, a short opportunity exists targeting 40,800 - 40,500.
🔹 Wait for a clean break and retest of 41,200 before shorting.
🔥 Will US30 bounce back from this demand zone, or will we see further drops? Comment your thoughts below! 👇
📊 Like & Follow for more trade ideas! 🚀
#US30 #DOWJONES #StockMarket #TechnicalAnalysis #PriceAction #DayTrading #Forex #SupplyAndDemand

Dow Jones Instant AnalysisAt the intersection of the midline of the two ascending and descending channels, there is a possibility of a short-term upward price reversal.

Short Dow JonesBy currently following the market structure, I'm shorting the DOW.
* Break of the previou low
* Resistance created at the 78.6 - 61.8 fib level, plus the rejection wicks spotted at the same level;
*

US30 Trade Update – 03/04/2025 🚨 US30 Trade Update – 03/04/2025 🚨
📉 Massive Rejection & Sell-Off!
US30 has broken below 41,300 and is now testing key support at 41,184. Bears are in control, and a further drop to 40,678 is on the table if this level breaks.
🔍 Key Observations:
✅ Breakdown from 42,359 Resistance
✅ Failed to Hold Above 41,749 Support
🔻 Next Major Support: 40,678
🎯 Trade Plan:
🔹 Short below 41,184 → Target 40,678
🔹 Long only if price reclaims 41,550+
⚠️ Watch for a reaction at 41,184 before confirming direction.
