US30 Technical Overview – 06/20/2025📍 US30 Technical Overview – 06/20/2025
After dropping below the 42,472 support zone, US30 is attempting a minor bounce from the 42,000 region. Momentum remains weak with EMA pressure overhead.
🧠 Key Observations:
Clean breakdown below 42,472 📉
EMA resistance still intact (42,085)
Weak recovery after tapping 41,900 area
📊 Price Zones:
🔼 Resistance: 42,472 → 42,600
🔽 Support: 41,900 → 40,983
📈 Trade Setup Ideas:
🔹 Long Bias:
Only if price breaks & holds above 42,472
→ Target: 42,700+
🔻 Short Bias:
Rejection from 42,085–42,100
→ Target: 41,900 → 41,200 → 40,983
🕵️♂️ Still inside a potential distribution phase. Stay patient — let price pick direction before sizing in!
US30 trade ideas

Us30 Key Levels on the Daily Timeframe – Quick Analysis:
🔴 Resistance Zones:
1. 42800 – 42950 🔺
• This area marked a strong top and rejected price multiple times
• If price returns to this zone, a strong rejection is likely
2. 42250 – 42400
• Previous correction area, may act as short-term resistance
• Useful zone to exit partial long positions if price bounces back
⸻
🟢 Support Zones:
1. 41700 – 41750 🧱
• Nearest support zone, price is currently close
• A break below this could trigger further downside
2. 41480 – 41550 🔻
• Medium support from a previous low (May)
• Breaking this opens downside toward 41000
3. 40700 – 40800
• Strong support from a major bottom
• A break here could open the way to 390 00–38000
⸻
📉 Chart Notes:
• Currently forming a potential double top near 42900
• The downtrend seems active as long as price stays below 42250–42400

US30 LONGSAlthough the hourly may ne considered bearish, we are currently approaching a respected support zone as seen from the 4h and above.
I have highlighted a strong 4h Demand as a potential point of entry, unsure about long target and stop loss zones, so I personally will be sticking to my ratioed take profit as usual - 100:300.
I do hopefully see some strong bullish movement coming in over the next few days.
Strictly technical analysis
lankss
US30 TodayUS30 Today is still bearish
My SSM Reversal Pattern is comming.
This is just my view of course

US30: Absolute Price Collapse Ahead! Short!
My dear friends,
Today we will analyse US30 together☺️
The recent price action suggests a shift in mid-term momentum. A break below the current local range around 41,858.0 will confirm the new direction downwards with the target being the next key level of 41,737.4 .and a reconvened placement of a stop-loss beyond the range.
❤️Sending you lots of Love and Hugs❤️

Yesterday DOW - Shorts🔻 US30 Reversal: How the Indicator Gave the Short from the Top
Yesterday, the ELFIEDT – X-REVERSION indicator gave stacked SELL signals near the very top of the move on US30 (15m chart) — before the full selloff began.
🧠 Here's how disciplined traders could have executed it step-by-step:
1️⃣ Signal Confirmation
A double “DOWN” label printed at the close of a large bullish candle.
This is where most retail traders are still buying — but the indicator identifies it as potential exhaustion.
2️⃣ Immediate Action Plan
Once the bar closed, a short trade could be entered at market or on a minor pullback.
✅ Stop-loss is always placed just above the signal candle’s high.
This setup offers minimal risk and sets up a great R:R profile.
3️⃣ Trade Progression
The next few candles confirmed rejection.
Even after some sideways chop, price continued lower — eventually giving up 400+ points from the signal area.
4️⃣ Why It Worked
Price was overextended.
RSI confirmed reversal (bearish momentum shift).
Signal printed on the close, giving live execution opportunity — no repainting.
✅ Key Lesson: The strongest trades with this system come when you follow the rules without hesitation. The signal doesn't lag — it prints at the very edge of emotion and momentum.
💡 Bonus Tip: If you trade other US indices like NAS100 or SPX at the same time — when they all print reversal signals simultaneously, the move is usually stronger.
📍 This was a textbook short setup using X-REVERSION.

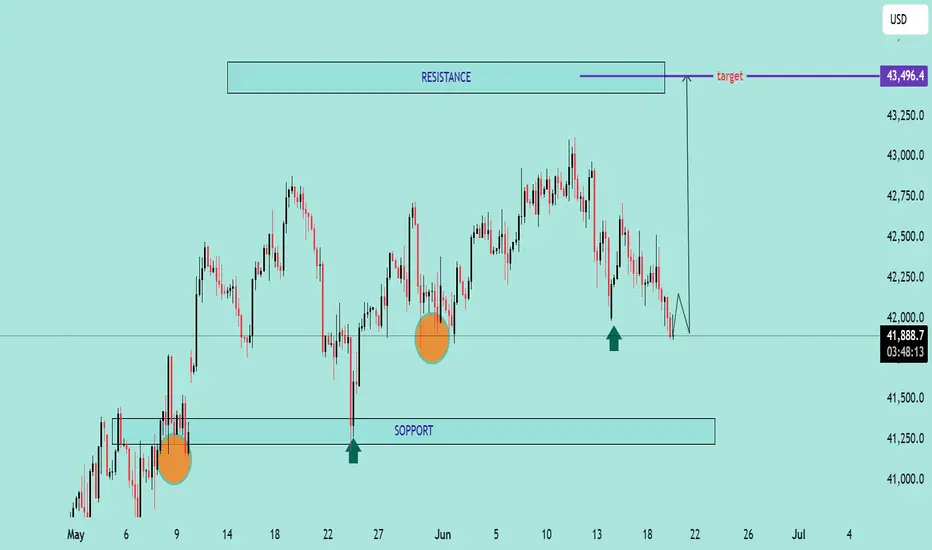
US30 Potential Rebound from Key Support Zone
US30 Potential Rebound from Key Support Zone 🚀📊
📉 Analysis Overview:
The US30 (Dow Jones Index) is currently testing a major support zone near the 41,800–41,900 range, a level that has held firm multiple times in the past (highlighted with green arrows and orange circles). This area has acted as a demand zone, leading to strong bullish reactions previously.
🔍 Key Technical Highlights:
🔸 Support Zone: Clearly respected at ~41,800. Price is once again bouncing here.
🔸 Resistance Zone: Around 43,250–43,500. This area has acted as a ceiling, where price struggled to break through.
🟢 Reversal Indicators: Multiple successful defenses of the support zone suggest accumulation and possible bullish reversal.
📈 Target Projection: If support holds, the price may rally toward the target zone near 43,496.4, as shown by the purple arrow.
📌 Conclusion:
As long as the 41,800 support holds, US30 shows bullish potential toward the 43,500 resistance. A break below this zone would invalidate the bullish scenario and shift focus back to the lower support near 41,250.
🛑 Risk Management Tip: Watch for confirmation candles and volume before entering long positions. Always set a stop-loss below the support zone.
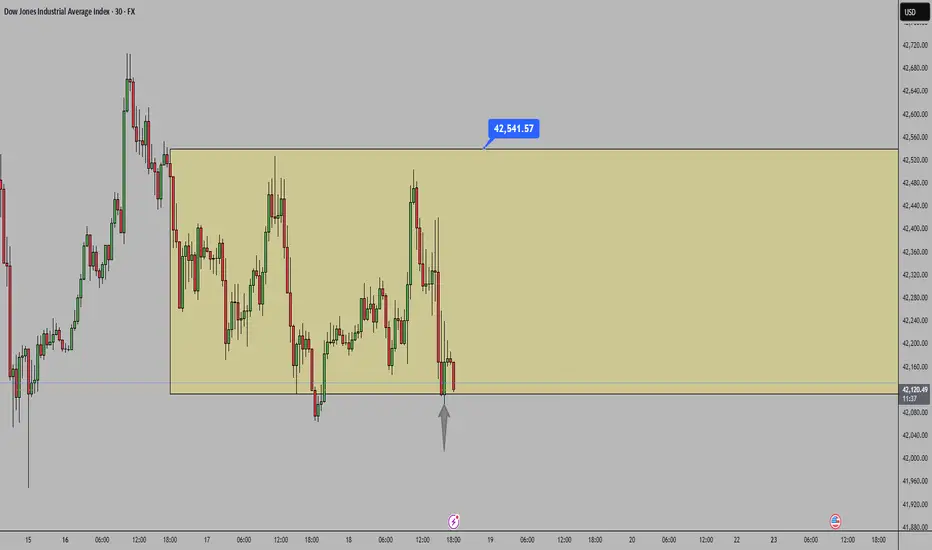
US30 Breaks Key Support as Geopolitical Risk Weighs on SentimentUS30 – Technical Overview
Amid rising Middle East tensions, the indices market remains under bearish pressure, with risk-off sentiment dominating.
US30 dropped to the 42160 level, as previously forecasted, and has now broken below it.
As long as the price trades below 42160, the bearish trend is expected to continue toward 41780, and potentially 41310 if that level fails to hold.
Key Levels:
• Pivot: 42160
• Support: 41900 / 41780 / 41310
• Resistance: 42310 / 42410 / 42580

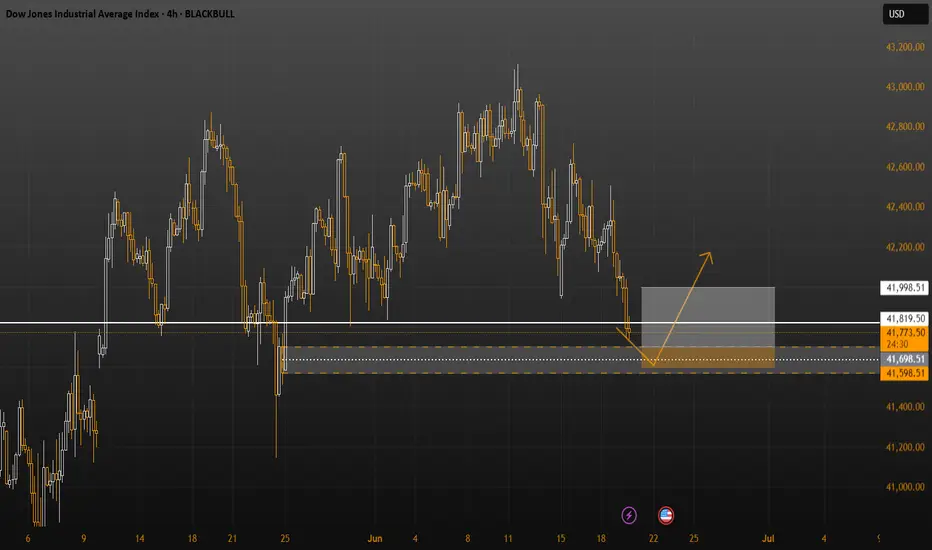
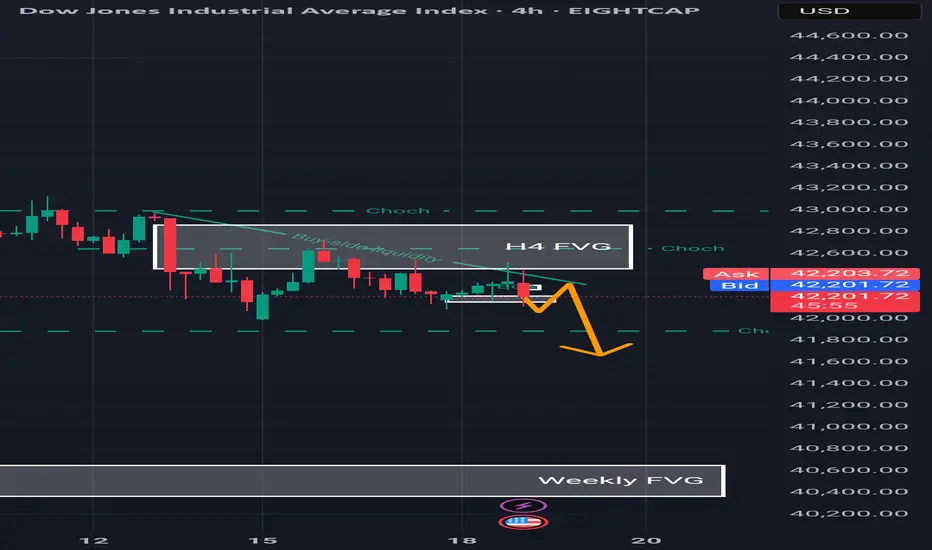
US30 Under Pressure: Possible Short Setup Brewing on the 4HI'm currently eyeing the US30 (Dow Jones Index) for a potential short opportunity based on multi-timeframe structure 📊.
🔍 Weekly Overview:
The weekly chart continues to show sustained pressure, with this week and last week both closing bearish. The sellers are clearly in control at the macro level. 🔻
📆 Daily & 4H Structure:
Drilling down to the daily and 4-hour charts, we can clearly see a break of structure (BOS). The 4H specifically is showing textbook signs of a bearish trend with lower highs and lower lows forming consecutively 🪜🔽.
🎯 Trade Plan:
I'm watching for a pullback into equilibrium, ideally near the 50% level of the recent Fibonacci range. If price revisits that zone, I’ll be looking for short confirmations to ride the momentum back toward the previous lows, as marked on the chart. 🧠💸.

Dow Jones Potential UpsidesHey Traders, in today's trading session we are monitoring US30 for a buying opportunity around 41,900 zone, US30 is trading in an uptrend and currently is in a correction phase in which it is approaching the trend at 41,900 support and resistance area.
Trade safe, Joe.

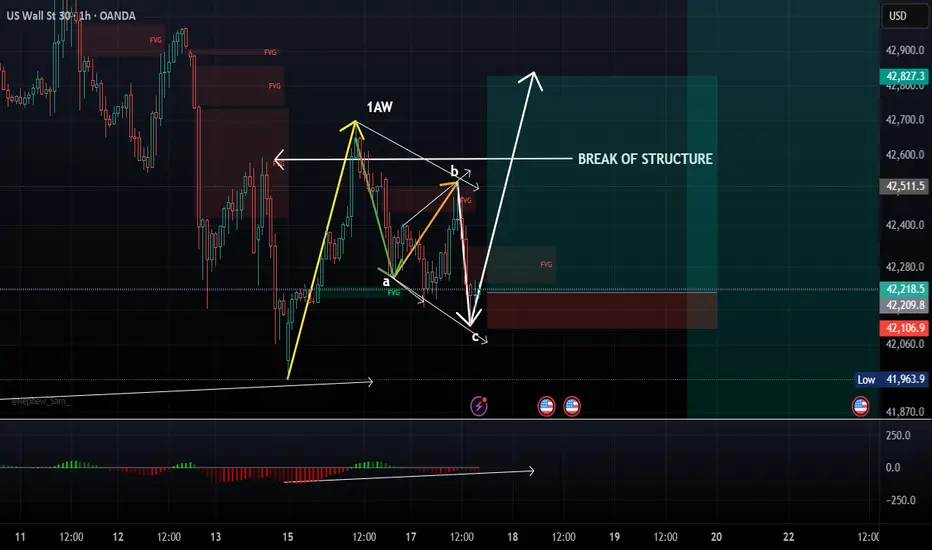
US30/DJ30 Long/buy 1:6Reason for buy:
VERY SIMILAR STRUCTURE TO GOLD!!!!!
1. Break of structure
2. Regular flat in play with a complete corrective structure (a,b,c)
3. NO MACD divergence shows strong moment upwards
4. Impulsive move (1AW) indicates a strong move upwards will continue
5. Liquidity at the top (TP area)
Entry: CMP (Current market price)
Stop loss :42086
Take Profit: At own discretion...OPEN!
Strategy/ies: Engulfing candle on 15/1HR TF
Losses are part of the game...don't be too hard on yourself!
US 30 Idea Wait Weekly candle to be broken to enter long sell position ...if not broken then still making dramas in OTE areas

US30US‑30 (Dow Jones) – Bullish Setup Based on COT
Large speculators added +1,319 contracts to net long exposure in mini futures, now at +7,114. Consolidated DJIA futures show similar sentiment at +5,795 net long, above recent averages. This indicates sustained bullish bias.
Us30 sellThe EMAs provide insight into the overall trend direction. Currently, the US30 is trading above the shorter-term EMAs, indicating a bullish sentiment in the market. The Relative Strength Index (RSI) is currently showing divergence on the daily time frame.
Great Depression 2.0 Starting in 2030?Looking at the Dow Jones, we can see clear cycles forming on this index. I believe we could see one more major run on the Dow between now and 2030, followed by a repeat of the Great Depression. I could easily be wrong, but the charts suggest this is a very real possibility.
So, between now and our potential top in 2030, we have an opportunity to make a significant amount of money in markets like crypto.
As always, stay profitable.
– Dalin Anderson

SELL US30US30 is currently testing a macro-level resistance zone that has historically reversed price sharply. The current market behavior hints at a bearish rejection, with a projected move toward 37K first, and potentially 34K later, if broader market sentiment shifts risk-off. This setup provides a favorable risk-reward ratio for swing short traders, especially if confirmed by price action triggers in the coming days.

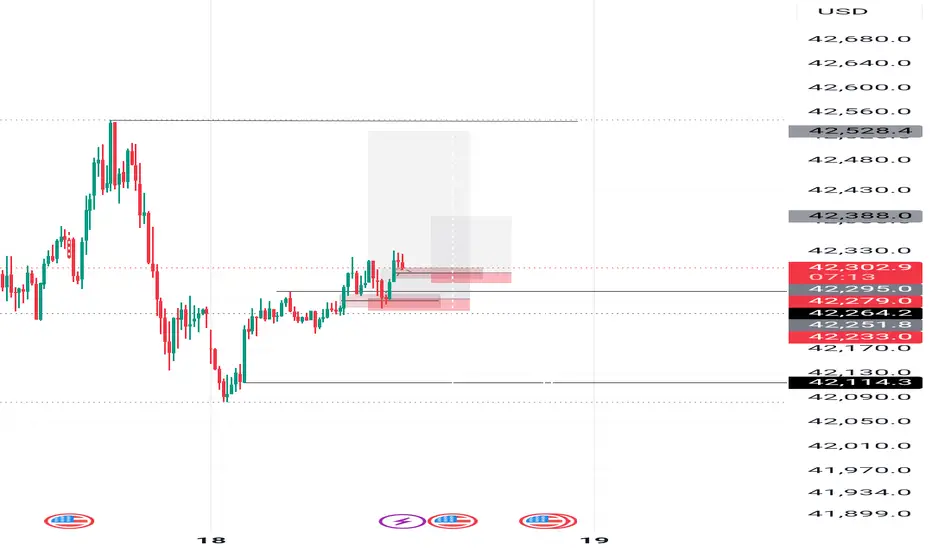
DOW30/US30 - ACTIVE TRADE - PROFITABLE SET UP TRADETeam,
today I have provide LIVE trading today provide you i did a good trade for
NAS100, DOW30 AND DAX30 - in real LIVE trading
OK, I prefer to SET UP my limit order today only. Remember, the market will be very volatile in the next 4 hours.
I expect the RATE should cut 25 points at least. Why
the employment data come out remain the same
inflation last week look under control
Retails is poorly come out today
The FED does not care about the America, they just care about taking advantage of America.
Lets now focus on the SETTING BUY LIMIT ORDER
I order small volume at 41975-42075
However I will double up at LIMIT BUY ORDER
The 1st target are looking at 4227542300
Target 2 - 42575-42675
REMEMBER - IF IT DOES NOT HIT YOUR ENTRY, JUST WALK AWAY.

DOW JONES Analysis This is U30 through my current lens, investigations of price action from W - D - 4H suggest Bullish.
factoring in the current fundamental conditions, I observe the US Dollar.
Monitor the US100 & US500 for any irregular correlation in price delivery between the 4H - 15M
I seek price to attack "Highs" and sustain strong "Lows".

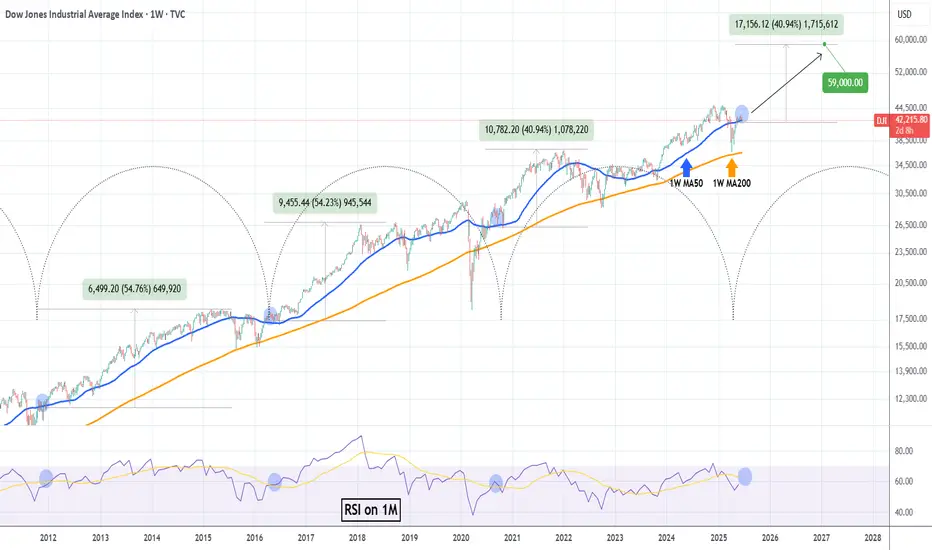
DOW JONES 15 year Cycles are coming to play.Dow Jones (DJI) is consolidating on its 1W MA50 (blue trend-line) for the past month. Based on a remarkable cyclical frequency as the Time Cycles show, every time this 1W MA50 consolidation takes place since October 2011, it turned into the long-term Support that supported rallies of at least +40.94%.
As their 1M RSI readings also sync, we can expect the current consolidation to end soon and drive the market to at least a +40.94% rise from the 1W MA50. Our long-term Target on this is 59000.
-------------------------------------------------------------------------------
** Please LIKE 👍, FOLLOW ✅, SHARE 🙌 and COMMENT ✍ if you enjoy this idea! Also share your ideas and charts in the comments section below! This is best way to keep it relevant, support us, keep the content here free and allow the idea to reach as many people as possible. **
-------------------------------------------------------------------------------
💸💸💸💸💸💸
👇 👇 👇 👇 👇 👇
US30 Is Bearish! Sell!
Here is our detailed technical review for US30.
Time Frame: 12h
Current Trend: Bearish
Sentiment: Overbought (based on 7-period RSI)
Forecast: Bearish
The market is approaching a significant resistance area 42,254.4.
Due to the fact that we see a positive bearish reaction from the underlined area, I strongly believe that sellers will manage to push the price all the way down to 41,307.3 level.
P.S
Overbought describes a period of time where there has been a significant and consistent upward move in price over a period of time without much pullback.
Disclosure: I am part of Trade Nation's Influencer program and receive a monthly fee for using their TradingView charts in my analysis.
Like and subscribe and comment my ideas if you enjoy them!

Bull Run To New Highs?The Dow got slammed on Wednesday, down 2%, no follow through yesterday.
Despite all the look of this rally being a bounce to sell, notice the uptrend line of support developed, this is the dynamics of markets, morph and twist to shake out weaker hands.
Would not be surprised to see a resumption of this rally to all time highs into June/July, the tariff wobbles are gone for now, any firm close below the trend line changes the trend.
We buy this market now at support in prospect of a larger rally to resume.
Appreciate a thumbs up, Good Trading & God Bless you all!

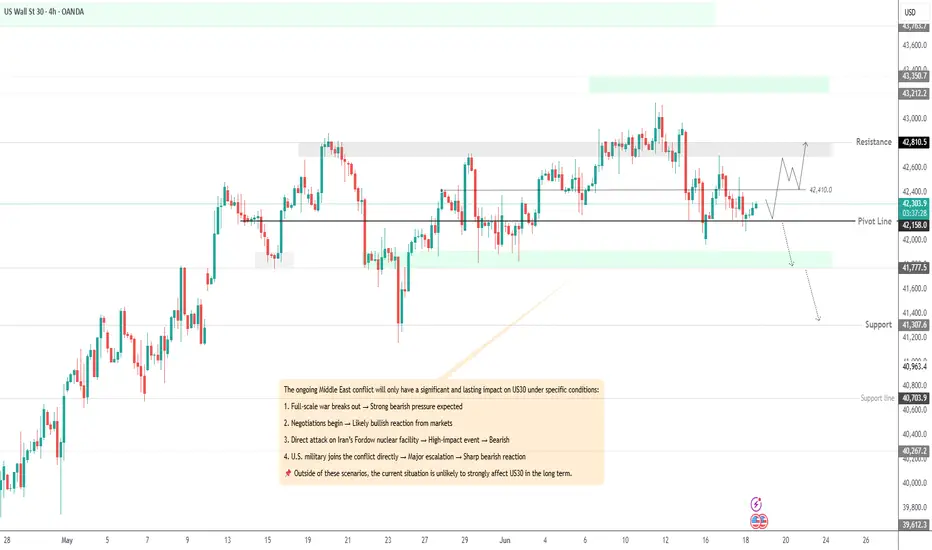
US30 Stabilizes Above Key Support Amid Geopolitical TensionsUS30 – Overview
The price reacted modestly to ongoing Middle East tensions, reaching our previously mentioned pivot zone at 42160, then reversed and stabilized within the bullish territory.
Technical Outlook:
As long as the price holds above 42160, bullish momentum is expected to continue toward 42410.
A 1H close above 42410 would confirm further upside toward 42610 and 42810.
🔻 To shift into a bearish trend, the price must close below 42160 on the 1H or 4H timeframe, which could lead to a move down to 41780.
Key Levels:
• Pivot: 42310
• Resistance: 42410 / 42610 / 42810
• Support: 42160 / 41970 / 41780