DOW Might Recover From Today's LossesIsrael's attack on Iran's nuclear facilities has unsettled the markets. After a weak start, the indices, such as the DJIA, initially made little headway and were unable to recover their losses.
We do not expect the markets to plunge to their doom now, but to recover soon.
For the Dow, we initially expect new lows in the entry area shown and then a recovery to the target zone in the coming week.
US30 trade ideas


DOW JONES: Will the 4H MA200 produce a rally?Dow is neutral on its 1D technical outlook (RSI = 51.949, MACD = 356.820, ADX = 20.639), trading between its 4H MA50 and MA200 in the past 2 days. The price just hit the 4H MA200 for the 2nd time again at the bottom of the Channel Up. As long as it holds, the pattern can initiate the new bullish wave. We exepct it to repeat the +3.74% rise of the one before, TP = 43,550.
See how our prior idea has worked out:
## If you like our free content follow our profile to get more daily ideas. ##
## Comments and likes are greatly appreciated. ##

SMC 1-10Let's see if this trade goes well.
Testing the Luxalgo SMC indicator.
We now have the highest and lowest CHoCH for buys.
2 ob for buys.

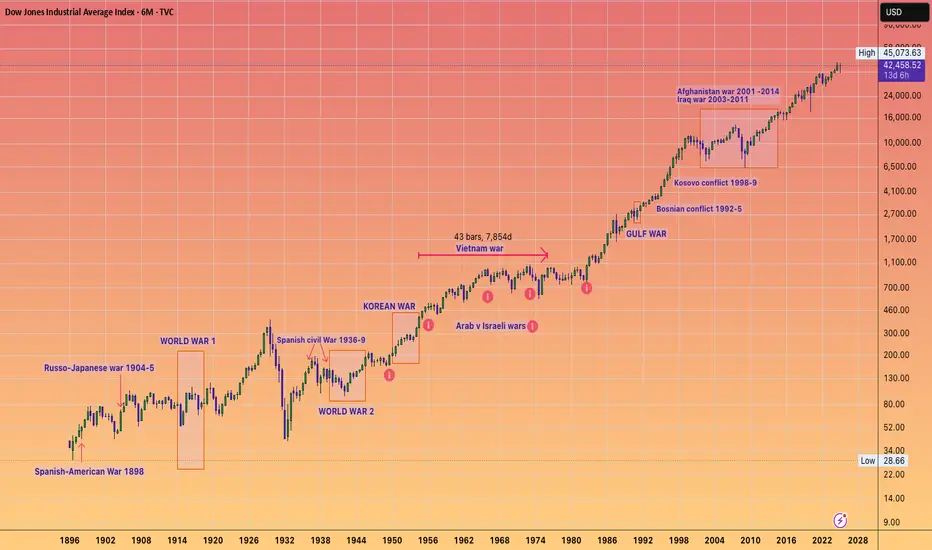
Don't SELL your bags Because of WAR FUDThey just end up turning up the money printer anyway...
DJI set amongst the major wars and conflicts the past century...
( I could have added way more wars to this chart but it would have been difficult to read all of them )
US30 Consolidates Amid Geopolitical UncertaintyUS30 Overview – Market Caught Between Geopolitical Risk and Technical Boundaries
The ongoing Middle East crisis continues to weigh on market sentiment, keeping US30 (Dow Jones) in a consolidation phase.
Technical Outlook:
Price is currently trading between 42160 and 42410.
As long as it holds above 42160, a move toward 42410 remains likely.
🔺 A break and stability above 42410 would confirm bullish momentum toward 42810.
🔻 A break below 42160 opens the door for a decline toward 41780, with further downside potential.
Key Levels:
• Pivot: 42410
• Support: 42160 / 41780 / 41310
• Resistance: 42610 / 42810 / 43210

DowJones resistance retest at 42880Key Support and Resistance Levels
Resistance Level 1: 42880
Resistance Level 2: 43540
Resistance Level 3: 42940
Support Level 1: 41800
Support Level 2: 41400
Support Level 3: 41100
This communication is for informational purposes only and should not be viewed as any form of recommendation as to a particular course of action or as investment advice. It is not intended as an offer or solicitation for the purchase or sale of any financial instrument or as an official confirmation of any transaction. Opinions, estimates and assumptions expressed herein are made as of the date of this communication and are subject to change without notice. This communication has been prepared based upon information, including market prices, data and other information, believed to be reliable; however, Trade Nation does not warrant its completeness or accuracy. All market prices and market data contained in or attached to this communication are indicative and subject to change without notice.


US30 Technical Overview – 06/17/2025📍 US30 Technical Overview – 06/17/2025
The Dow is consolidating below resistance after failing to reclaim the 42,424 EMA zone. Sellers are defending this level, while 42,102 remains a key support.
🧠 Key Observations:
EMA rejection near 42,424 🔄
Lower highs forming = short-term bearish bias
Demand still holding at 42,102
📊 Price Zones:
🔼 Resistance: 42,424 → 42,605
🔽 Support: 42,102 → 41,947
📈 Trade Setup Ideas:
🔹 Long Bias:
Break and hold above 42,424
→ Target: 42,605 → 42,793
🔻 Short Bias:
Break below 42,102
→ Target: 41,947 → 41,894
🎯 Price is currently between key levels—wait for a breakout before committing to direction!

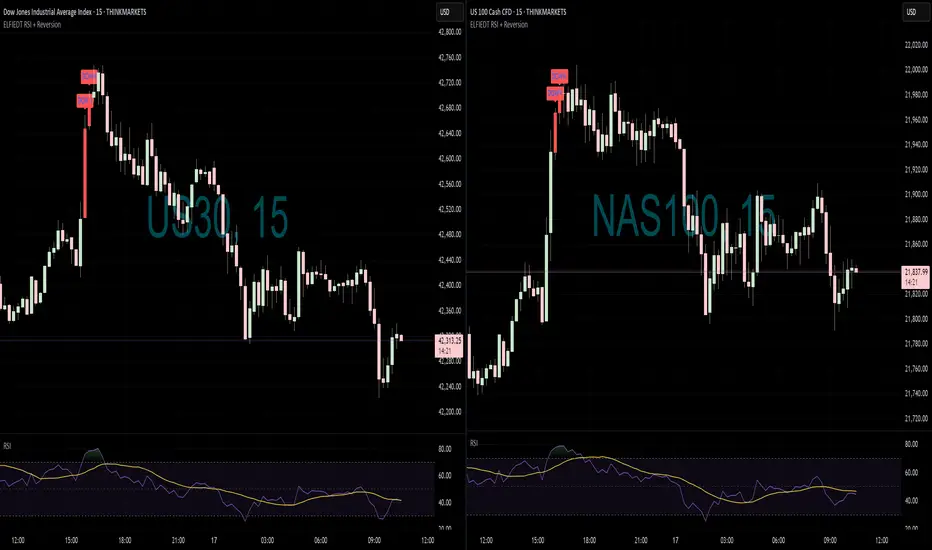
SHORTS - GOTTA LOVE IT!📊 Multi-Market Signal Alignment: US30 & NAS100 (15-Min)
📍 Both indices triggered clean SELL signals at their highs using the ELFIEDT – X-REVERSION indicator.
The signal printed at the close of the strongest bullish bar, which often marks exhaustion — and price quickly rejected from that level.
✅ US30 printed two stacked 'DOWN' signals — the first entry bar was perfect.
✅ NAS100 printed a nearly identical signal at the same time — showing excellent intermarket confluence.
🧠 Why this setup worked:
Price extended far above mean structure
RSI was stretched and reversed immediately after
Signal printed on a bullish candle before reversal — allowing you to catch the high
Both assets signaled at the same time — strengthening the conviction
📌 Pro Tip: When multiple correlated instruments print reversal signals at the same time (especially indices or FX pairs), it often confirms institutional rotation. These trades offer great risk-reward if you stick to the plan.
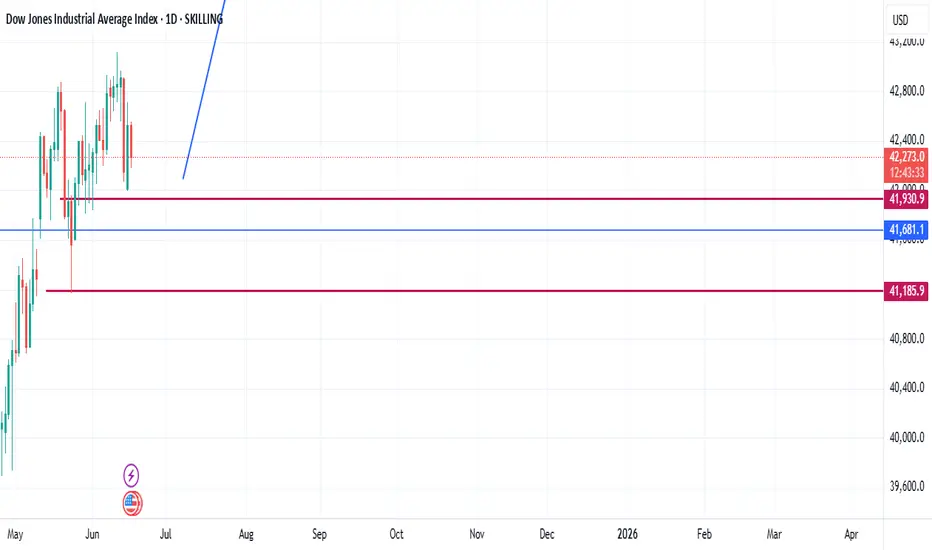
US30 17 JUNE 2025 TRADE IDEA Based on the current US30 (Dow Jones Industrial Average Index) chart, the price action shows a strong bullish trend within a well-defined ascending channel that spans from mid-2023 through 2025. The index recently bounced off the mid-range zone near the 41,185 – 41,940 support levels and is now approaching a potential continuation move toward the upper resistance zone between 44,472 and 44,620. This area represents a key supply zone where price previously rejected, suggesting potential hesitation or reversal upon retest. The recent higher lows and breakout from a corrective phase indicate strong bullish structure, supported by institutional order flow—possibly driven by buy-side liquidity targeting previous highs. If the price maintains above 41,681 and creates a successful retest (break and retest confirmation), it offers a compelling opportunity for long positions aiming toward the channel top or key resistance.
From a Smart Money Concept (SMC) perspective, the market structure shifted bullish after sweeping liquidity below April's low followed by a clear Change of Character (ChoCH) and Break of Structure (BOS) to the upside. This shows strong accumulation by institutions. The demand zone formed around 41,185 – 41,681 can be considered a reaccumulation block and a potential entry point for buys on retracement.
Fundamental Context:
This week's movement must also be interpreted in light of broader geopolitical tensions, particularly the ongoing conflict between Iran and Israel, which has implications on investor sentiment and global market volatility. Heightened tensions in the Middle East typically cause oil prices to spike and introduce risk-off sentiment. However, the Dow’s resilience suggests that U.S. investors may currently be pricing in confidence in the U.S. economy, strong corporate earnings, or the expectation that the Fed will maintain or cut interest rates if geopolitical shocks affect global demand. If tensions escalate further into military confrontation or affect major oil supply chains, we could see a temporary pullback or risk aversion across equities—including US30.
Trade Idea:
Bias: Bullish continuation (if current structure holds).
Entry Zone: Around 41,940–42,100 on a retest with bullish confirmation.
Stop Loss: Below 41,185 (structure invalidation).
Take Profit: First TP at 44,472; extended TP at 44,620 or channel top.
Invalidation: Break below 41,185 with a daily close.
In conclusion, unless the conflict between Iran and Israel leads to a sharp risk-off move, US30 appears poised for bullish continuation driven by technical momentum, strong market structure, and medium-term economic optimism. However, traders should monitor headlines closely, as escalation in the Middle East could introduce significant volatility.
Tuesday Outlook #us30Tuesday Outlook #US30. As we head into the Fed's Decision. Be careful trading today.

US30 – Bearish Setup Below Resistance Zone US30 – Bearish Setup Below Resistance Zone 🚨🟥
The US30 index is exhibiting signs of bearish momentum after repeated rejections from the key resistance zone near 43,200. Let's break down the technical picture:
🔍 Technical Analysis
📌 Resistance Zone (🟥 43,200 area)
Price was rejected twice from this resistance (marked by red arrows), showing strong seller presence.
Bearish candlesticks followed each touch, confirming exhaustion near this level.
📌 Support Zone (🟦 40,800 area)
The area around 40,800 has acted as a strong demand zone in the past (highlighted with green arrows and orange circles).
Price might revisit this area if current bearish structure continues.
📌 Intermediate Support (🟪 41,828)
This level serves as short-term support.
If broken, it could accelerate the decline toward the major support.
📌 Market Structure
Lower highs forming after each bounce indicate weakening bullish strength.
A potential bearish breakout pattern is forming (highlighted by the projected path).
📈 Conclusion & Trade Outlook
Bias: Bearish 📉
Trigger: Break below 41,828 support
Target: 40,800 zone
Invalidation: Break and close above 43,200 resistance

DOW30/US30 - TIME TO MAKE MILLIONSTeam, Time to LONG SMALL POSTION ON US30 now
ADD DOUBLE UP at 41950-41800 - kill them if they drop this price range
Target 1 at 42400-42440
TAKE 50-70% volume for profit once it hit 1st target
BRING STOP LOSS TO BE and the remaning for 2nd target.

Potential bearish drop?Dow Jones (US30) has rejected off the pivot, which acts as an overlap resistance and could drop to the pullback support.
Pivot: 42,584.80
1st Support: 41,458.80
1st Resistance: 43,086.08
Risk Warning:
Trading Forex and CFDs carries a high level of risk to your capital and you should only trade with money you can afford to lose. Trading Forex and CFDs may not be suitable for all investors, so please ensure that you fully understand the risks involved and seek independent advice if necessary.
Disclaimer:
The above opinions given constitute general market commentary, and do not constitute the opinion or advice of IC Markets or any form of personal or investment advice.
Any opinions, news, research, analyses, prices, other information, or links to third-party sites contained on this website are provided on an "as-is" basis, are intended only to be informative, is not an advice nor a recommendation, nor research, or a record of our trading prices, or an offer of, or solicitation for a transaction in any financial instrument and thus should not be treated as such. The information provided does not involve any specific investment objectives, financial situation and needs of any specific person who may receive it. Please be aware, that past performance is not a reliable indicator of future performance and/or results. Past Performance or Forward-looking scenarios based upon the reasonable beliefs of the third-party provider are not a guarantee of future performance. Actual results may differ materially from those anticipated in forward-looking or past performance statements. IC Markets makes no representation or warranty and assumes no liability as to the accuracy or completeness of the information provided, nor any loss arising from any investment based on a recommendation, forecast or any information supplied by any third-party.

Us30,Nas& Bitcoin are selling today As you can see that yesterday buy closed daily candle at 42711.2 forming a resistance. I am 100% sure that bears are taking control as my daily timeframe and weekly time frame also showing signs of market sells.for today my target will be at 41978.5 if it pushes low I will set sell order at 4Hr time frame to 41931

Dow Jones Approaches Two-Month Highs AgainThe Dow Jones index has started the week with a strong bullish bias, pushing the price up by more than 1% in the short term. This upward trend has remained solid despite growing military tensions in the Middle East. While the conflict caused significant volatility last week, markets have now digested the uncertainty, with CNN’s Fear and Greed Index remaining steady in the “greed” zone, showing no signs of retreating toward neutral territory. This suggests that confidence remains firm in the short term, allowing demand for risk assets like the Dow Jones to stay consistent in recent sessions.
However, it is important to note that the Dow has historically shown significant sensitivity to trade war developments. Although ongoing negotiations between the United States and China continue, the outcome regarding tariffs remains uncertain. If no agreement is reached, negative trade dynamics could resurface, triggering a renewed loss of confidence and possibly leading to sustained selling pressure in the long term.
Consistent Bullish Trend
Since early April, the Dow Jones has maintained a strong buying trend, with price movements consistently above the 40,000-point level. So far, there have been no major bearish corrections that would break this structure. However, the price is currently facing a key resistance level. If this barrier holds, it could mark the beginning of a corrective phase in the short term.
Technical Indicators:
RSI: The RSI line has begun to show a bearish divergence, as it records lower highs, while the Dow’s price posts higher highs. This reflects an imbalance in market forces, which may lead to short-term downside corrections.
TRIX: The TRIX line, which measures the momentum of exponential moving averages, remains above the neutral level (0), but has started to flatten, potentially signaling the beginning of a neutral phase, especially as the price tests resistance zones.
Key Levels to Watch:
42,700 points: A critical resistance zone, aligned with the 200-period simple moving average. A breakout above this level would strengthen the current bullish bias and help consolidate the uptrend.
41,900 points: A short-term support level, associated with a recent neutral zone. It could act as a barrier against downward corrections.
41,064 points: The final support, aligned with the 50-period simple moving average. A drop to this level could threaten the ongoing bullish trend.
Written by Julian Pineda, CFA – Market Analyst
Follow him at: @julianpineda25

Wall Street Eyes Volatility: Dow Jones Tests Reversal ZoneUS30 (Dow Jones Index) — Clashing Forces of Risk & Reality
Technical Outlook — 16 June, 2025 | 1H Chart
Current Market Condition:
The Dow Jones (US30) has staged a recovery from the recent dip, but price is stalling at the Previous Day High (~42,588), a key confluence zone with the broken rising trendline, 50 EMA, and overhead supply.
This hesitation comes amid heightened global risk aversion triggered by the intensifying Iran–Israel conflict, adding pressure to global indices as investors rotate into safer assets like treasuries and gold. Despite intraday rebounds, equity bulls are showing signs of fatigue at resistance zones.
Markets are also bracing for upcoming US economic data and Fed commentary, which may further amplify intraday volatility.
Key Technical Highlights:
Price rejected from the confluence of PDH (~42,588), horizontal supply zone, and old rising trendline (yellow).
Currently hovering just under the 50 EMA; failure to hold could initiate a rotation back toward PD Low.
Stochastic RSI nearing overbought — suggests possible local top if no momentum breakout follows.
EMA 200 and the Previous Day Low at ~42,053 remain critical intraday supports.
Overall structure forming potential lower high under bearish macro cloud.
Trade Plan:
🔼 Bullish Breakout (Intraday Long):
Trigger: Break and sustained hold above 42,600 with rising volume
Target: 42,900 → 43,100
Stop Loss: Below 42,450 (to avoid whipsaws)
🔻 Bearish Rejection (Intraday Short):
Trigger: Clean rejection from PDH + trendline with bearish engulfing
Target: 42,100 → 42,050 → 41,850
Stop Loss: Above 42,650
⚖️ Neutral / Range Trade:
Play the range between PDH (~42,588) and PDL (~42,053) until breakout.
Scalp based on price reaction at either boundary with tight stop loss.
🛡️ Risk Management Note:
Global uncertainty tied to war escalation and Fed policy expectations make this a headline-driven market. News risk can spike volatility and invalidate technical setups. Trade with reduced size and increased caution, especially around US market open and geopolitical news cycles.
📢 If you found this analysis valuable, kindly consider boosting and following for more updates.
⚠️ Disclaimer: This content is intended for educational purposes only and does not constitute financial advice.

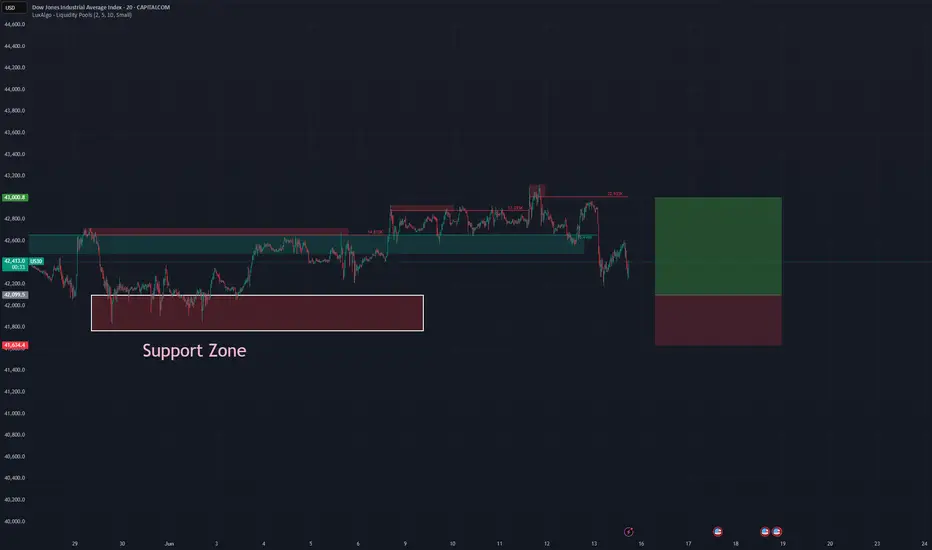
US30 Technical Analysis From that zone, I'm expecting US30 to keep flying. We should see a bit more push to the upside if price reacts to our zone.

US30 Long OpportunityUS30 had a break out to the upside from $42560 and we are not seeing a potentially retracement to the break and retest level where we can expect a further jump to the upside. Seeing bullish structure on the 15 min and higher timeframes with confluence at the breakout.
Price is currently above the 50 SMA on all timeframes above the 15min and momentum is bullish per the RSI trading above the 55 level, adding to the bullish confluence
Looking to the ride the bullish wave from $42560 to $42920 where currently resistance level is sitting

US30: Strong Growth Ahead! Long!
My dear friends,
Today we will analyse US30 together☺️
The recent price action suggests a shift in mid-term momentum. A break above the current local range around 42,682.9 will confirm the new direction upwards with the target being the next key level of 42,855.1 and a reconvened placement of a stop-loss beyond the range.
❤️Sending you lots of Love and Hugs❤️

Buy for R/R1Buy or Buy Limit @ 42615
SL: 42377
TP1: 42850
Signal from a backtested strategy with a win rate of 60 %.
Manage your risk...
