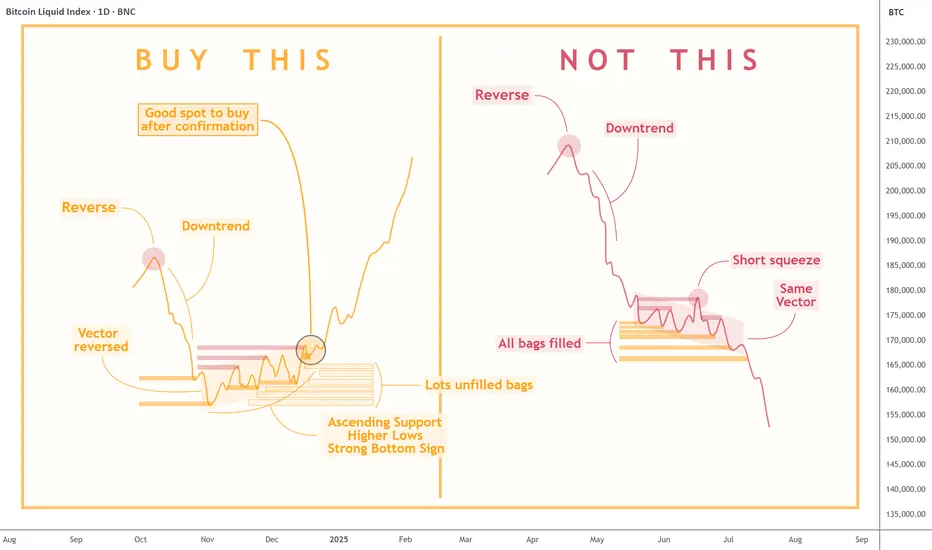
Quick Lesson: How to Identify Trend ReversalKnowing when to enter the market can mean the difference between making a profit and incurring a loss. The chart above clearly compares two similar-looking scenarios with very different outcomes: the one you should aim for and the one you should avoid.
- On the left , we see a textbook example of a bullish reversal. After a significant downtrend, the market prints higher lows and begins forming an ascending support. This signals that selling pressure is fading and buyers are stepping in. Notably, there are usually lots of unfilled bags — latecomers who show strong demand below the current price level but never get their orders filled, and who then just hit the 'market buy' button, which adds fuel to the fire of pump.
- In contrast, the right side shows a very similar pattern — a downtrend followed by consolidation, but with crucial differences. Here, all prior liquidity zones have already been filled, meaning there is less incentive for buyers to support the price. The “same vector” suggests price action hasn’t changed direction, and a common short squeeze traps late buyers before resuming the decline. This is a common bull trap , where a temporary price pump gives false hope before another leg down.
To sum up , a REAL REVERSAL builds on structure, accumulation, and higher lows—whereas a FALSE BOTTOM is often characterized by brief rallies, exhausted liquidity, and no change in vector trend. Experienced traders wait for confirmation and accumulation before entering a position, not just a temporary pause in a downtrend.
BLX trade ideas
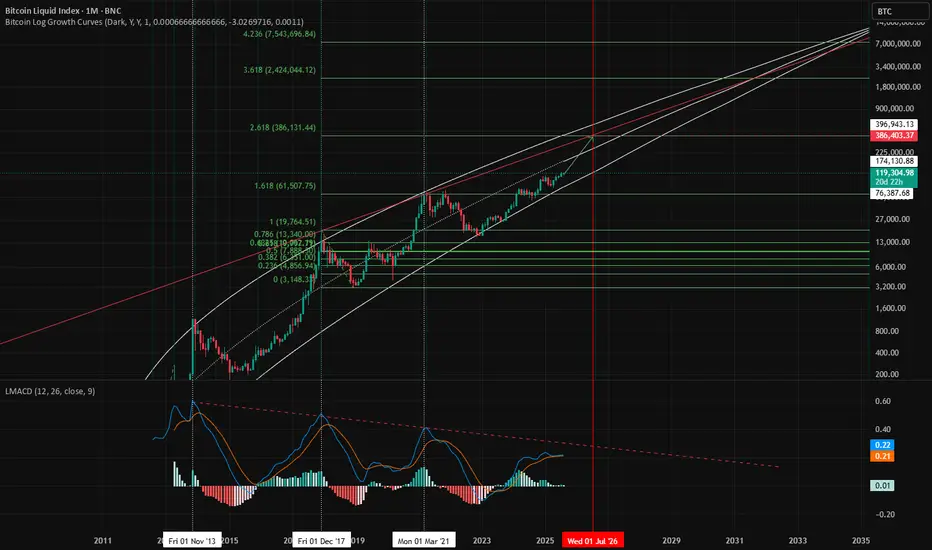
Math is Not Magic - BTCUSD Price Prediction 2026Looks like this pump will be extended. Using fibs on time and price, 380K is my target, timeframe is between March thru June of 2026. Watch for alts afterwards for rotation.
Good luck.
Btc Daily AnalysisBTCUSD just completed a 3 wave (b) correction to the downtrend from what I can see, expect further downward pressure. Watch for a target of around <$100k for the next leg down

Long term Bitcoin view: the path to $100kI think Bitcoin will make a correction in the short run. The next target price can be $42k.
However I predict further gains in price in the mid run. The target of $100k may be achieved then. Though it is a far stretched number, I still expect a price move to that level.
If fail, we can expect a complex correction for the next 2-3 years. Final long term target will be above $100k.
#BTCUSDTP

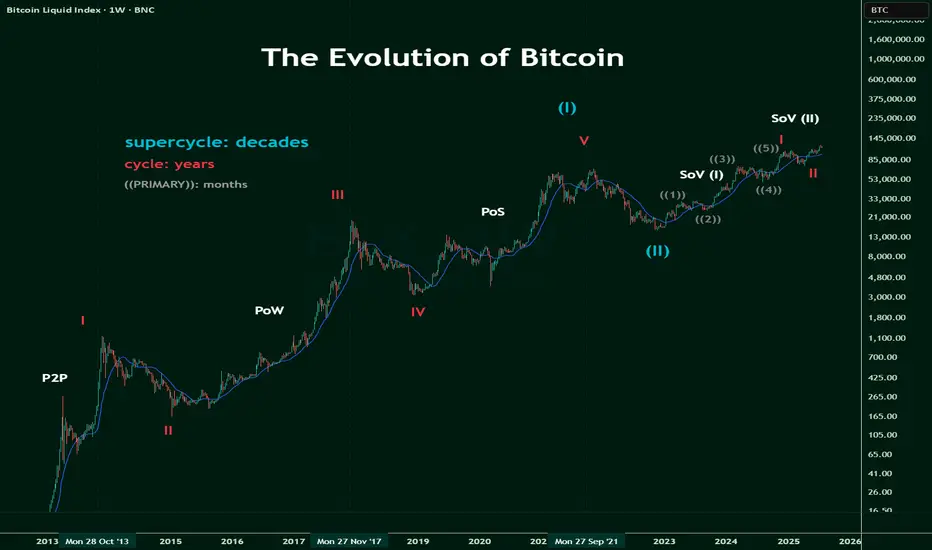
The Evolution of BitcoinNot Financial Advice
Born in 2009, bitcoin was a proof of concept out of an esoteric online forum.
It was intended as a secure, swift, P2P solution to transact on a global stage without global scrutiny nor supervision.
Sure it worked, but would it last?
Then Proof of Work, PoW , showed it's efficacy and prowess as years quickly approach a decade's worth.
It's value was recognised as the world gets stunned by CRYPTOCAP:BTC 's rally.
But then crypto winter came.
So did Ethereum, but this was to be Bitcoin's catalyst.
Programmers soon carved DeFi niche propelling Bitcoin's value as a staked token, by 'bridging' the asset onto Ethereum, where a slew of financial products and Dapps began to fight for dominance.
The world of Proof of Stake, PoS , began to take shape, cementing itself as the perfect complementary power to Bitcoin's security.
Of course, where there is money, bad actors appear, causing CRYPTOCAP:BTC to tumble as rugs get pulled and users are caught in the turmoil of poor regulation.
But regulators caught up and has since given the industry a fresh wind for its sails.
Institutions pile in, eager to avoid mass adoption, and Bitcoin cements itself as a Store of Value (SoV).
To note that there will be multiple stages for this SoV, as the first stage was the acceptance from corporations that Bitcoin is safe: SoV (I).
Cue SoV (II) today where blue chips and central banks are circling bitcoin, tempted to bite.
And the final form, SoV (III) will be the day when bitcoin is simply, ubiquitous.
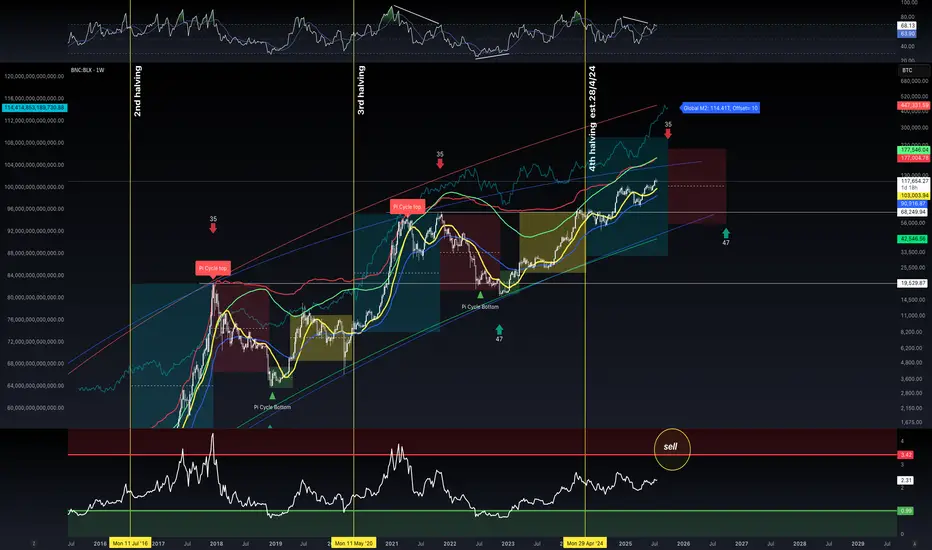
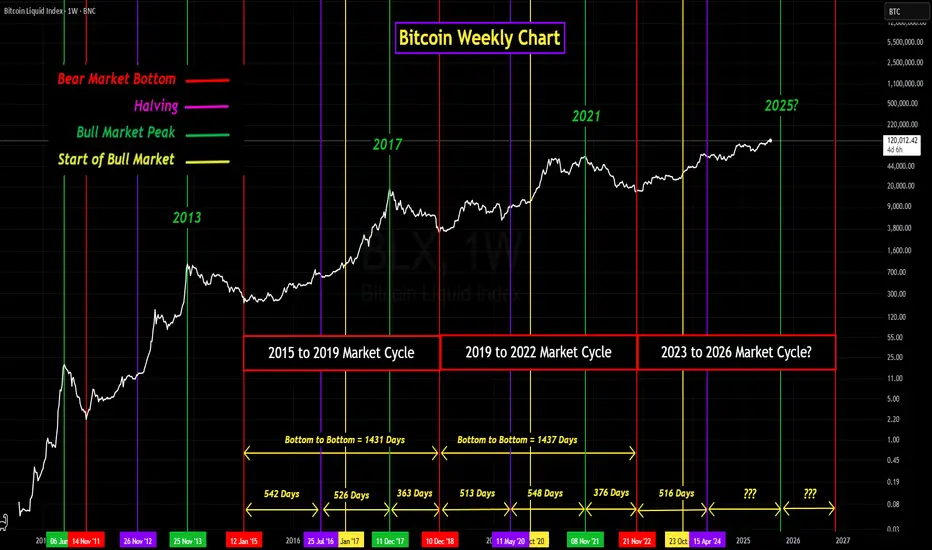
GROK's Analysis of Bitcoin's 4-Year Market CyclesIn the past I have published my own analysis of Bitcoin's 4-year market cycles, (cycles 2 and 3).
My purpose for analyzing the market cycles was to determine how similar in elapsed times the last two market cycles were to each other. Not only in the length of the overall market cycle but also between the major events, (bear market low to the halving, halving to the market cycle peak, and market cycle peak to the next bear market low).
The results of my analysis shocked me. Not only were the last two cycles very close in overall length but they were also (in my opinion) very close in the elapsed times between the major events. I was shocked because an open market, whether it is the stock market, crypto market, or any other openly traded market can be influenced by so many different factors both inside and outside of the market.
Internal factors that can influence an openly traded market could include, Supply and demand dynamics, market sentiment (investor psychology) and speculation, and market structure. External factors can include Macroeconomic conditions, Geopolitical events, Regulatory environment, Global events and crises, Interplay and volatility, and Monetary policy and liquidity. Then add into all of these influential factors that the Bitcoin market is traded globally, 24 hours a day, 7 days a week, and 365 days a year, it never closes.
Taking all of these influential factors into consideration, it boggles my mind how there could be so much consistency between the market cycles. Anyway, my reason for publishing this topic again is because my analysis was basic. So I asked GROK to analyze the last three market cycles including the current cycle and compile all the results into a report.
Can you analyze the last two Bitcoin 4-year cycles, (Jan. 14, 2015, to Dec. 15, 2018) and (Dec. 15, 2018, to Nov. 21, 2022), and compare them against each other?
Then analyze the current market cycle which started on Nov. 21, 2022, and note any similarities with the previous two market cycles. Also, if possible, try to predict when this market cycle peak might occur. Please also include any analysis that you can do on Global liquidity including United States M1 and M2 money supply trends, U.S. money printing, and any relationship / correlation to U.S. interest rates.
Please analyze the following along with any other pertinent data and make a comparison between the two cycles:
• The duration from bear market low (beginning of the market cycle) to the halving.
• The duration from halving to the market cycle peak price.
• The duration from the market cycle peaks to the next bear market lows.
• The duration of the overall market cycle (bear market low to the next bear market low).
• Percentage gain from the bear market low to the market cycle peak.
• Percentage loss from the market cycle peak to the next bear market low.
• Please include the dates of the bear market lows, market cycle peaks, and halvings.
• If possible, list the price corrections from each market cycle that exceed 20%. Also I want you to add any other pertinent data that you find in your analysis.
Note: For this report the current price for Bitcoin on July 22, 2025 at 9:40 Eastern Standard time is $119,556.82
Below is a detailed analysis of the last two Bitcoin 4-year cycles (2015–2018 and 2018–2022), a comparison of their key metrics, an examination of the current cycle (starting November 21, 2022), and an exploration of global liquidity, U.S. M1 and M2 money supply trends, U.S. money printing, and their correlation with U.S. interest rates. I’ve included the requested metrics (durations, percentage gains/losses, key dates, and price corrections exceeding 20%) and additional pertinent data such as macroeconomic factors and on-chain metrics. Finally, I provide a speculative prediction for the current cycle’s peak based on historical patterns and current trends.
Analysis of Bitcoin 4-Year Cycles
Cycle 1: January 14, 2015 – December 15, 2018
Bear Market Low: January 14, 2015, $176.90
Halving Date: July 9, 2016 (block reward reduced from 25 to 12.5 BTC)
Market Cycle Peak: December 4, 2017, $19,666
Next Bear Market Low: December 15, 2018, $3,122
Durations
Bear Market Low to Halving: 542 days (January 14, 2015 – July 9, 2016)
Halving to Market Cycle Peak: 513 days (July 9, 2016 – December 4, 2017)
Market Cycle Peak to Next Bear Market Low: 376 days (December 4, 2017 – December 15, 2018)
Overall Market Cycle (Bear Market Low to Next Bear Market Low): 1,431 days (~3.92 years)
Price Movements
Percentage Gain (Bear Market Low to Peak): ($19,666 - $176.90) / $176.90 = 11,018.09%
Percentage Loss (Peak to Next Bear Market Low): ($19,666 - $3,122) / $19,666 = -84.12%
Price Corrections Exceeding 20%
May 2017: ~30% correction (from ~$2,700 to ~$1,900)
June–July 2017: ~40% correction (from ~$3,000 to ~$1,800)
September 2017: ~35% correction (from ~$5,000 to ~$3,250)
December 2017 – February 2018: ~65% correction (from $19,666 to ~$6,900)
April–May 2018: ~35% correction (from ~$9,700 to ~$6,300)
November–December 2018: ~50% correction (from ~$6,300 to $3,122)
Key Observations
The 2015–2018 cycle was characterized by a prolonged accumulation phase post-2015 low, with the halving in July 2016 acting as a catalyst for a bull run.
The market peak occurred ~17 months after the halving, driven by retail investor enthusiasm and the ICO bubble.
The bear market was severe, with an 84.12% drawdown, exacerbated by the ICO bubble collapse and regulatory concerns.
Cycle 2: December 15, 2018 – November 21, 2022
Bear Market Low: December 15, 2018, $3,122
Halving Date: May 11, 2020 (block reward reduced from 12.5 to 6.25 BTC)
Market Cycle Peak: November 8, 2021, $67,589
Next Bear Market Low: November 21, 2022, $15,476
Durations
Bear Market Low to Halving: 513 days (December 15, 2018 – May 11, 2020)
Halving to Market Cycle Peak: 546 days (May 11, 2020 – November 8, 2021)
Market Cycle Peak to Next Bear Market Low: 378 days (November 8, 2021 – November 21, 2022)
Overall Market Cycle (Bear Market Low to Next Bear Market Low): 1,437 days (~3.94 years)
Price Movements
Percentage Gain (Bear Market Low to Peak): ($67,589 - $3,122) / $3,122 = 2,064.22%
Percentage Loss (Peak to Next Bear Market Low): ($67,589 - $15,476) / $67,589 = -77.10%
Price Corrections Exceeding 20%
March 2020 (COVID-19 Crash): ~50% correction (from ~$10,000 to ~$5,000)
May–July 2021: ~50% correction (from ~$64,000 to ~$29,000)
November 2021 – January 2022: ~40% correction (from $67,589 to ~$40,000)
May–June 2022 (Terra/Luna Collapse): ~45% correction (from ~$40,000 to ~$18,000)
November 2022: ~25% correction (from ~$20,000 to $15,476)
Key Observations
The 2018–2022 cycle saw a shorter accumulation phase before the halving, partly due to the COVID-19-induced liquidity injection in 2020.
The bull run post-halving was fueled by institutional adoption (e.g., Tesla, MicroStrategy) and retail FOMO, amplified by global stimulus.
The bear market was less severe than the previous cycle (77.10% vs. 84.12%), but events like the Terra/Luna collapse and FTX bankruptcy triggered significant corrections.
Key Similarities
Cycle Duration: Both cycles lasted approximately 4 years (~1,431–1,437 days), reinforcing the 4-year cycle tied to Bitcoin’s halving schedule.
Halving as Catalyst: In both cycles, the halving (2016 and 2020) marked the start of significant bullish momentum, with peaks occurring 513–546 days post-halving.
Bear Market Drawdowns: Both cycles experienced severe drawdowns (84.12% and 77.10%), though the 2018–2022 cycle was less extreme, possibly due to increased market maturity.
Multiple Corrections: Both cycles saw 5–6 corrections exceeding 20%, reflecting Bitcoin’s high volatility during bull and bear phases.
Key Differences
Percentage Gains: The 2015–2018 cycle had a much higher percentage gain (11,018.09% vs. 2,064.22%), likely due to Bitcoin’s lower starting price and the speculative frenzy of the ICO bubble.
External Influences: The 2018–2022 cycle was heavily influenced by macroeconomic events (COVID-19 stimulus, institutional adoption), while the 2015–2018 cycle was more driven by retail speculation and the ICO boom.
Correction Triggers: The 2015–2018 bear market was driven by regulatory fears and the ICO bubble collapse, while the 2018–2022 bear market was exacerbated by crypto-specific events (Terra/Luna, FTX).
Current Cycle: November 21, 2022 – Present (July 23, 2025)
Bear Market Low: November 21, 2022, $15,476
Halving Date: April 19, 2024 (block reward reduced from 6.25 to 3.125 BTC)
Current Price (July 22, 2025): $119,556.82
Market Cycle Peak: January 2025, ~$112,000 (based on X post sentiment, not definitive)
Durations (As of July 23, 2025)
Bear Market Low to Halving: 514 days (November 21, 2022 – April 19, 2024)
Halving to Current Date: 460 days (April 19, 2024 – July 23, 2025)
Overall Duration to Date: 974 days (November 21, 2022 – July 23, 2025)
Peak to Current Date: ~190 days (January 2025 – July 23, 2025, assuming peak at ~$112,000)
Price Movements (As of July 23, 2025)
Percentage Gain (Bear Market Low to Current Price): ($119,556.82 - $15,476) / $15,476 = 672.58%
Percentage Gain (Bear Market Low to Assumed Peak): ($112,000 - $15,476) / $15,476 = 623.83% (based on ~$112,000 ATH in January 2025)
Percentage Change (Assumed Peak to Current Price): ($119,556.82 - $112,000) / $112,000 = +6.75% (indicating no bear market low yet)
Price Corrections Exceeding 20% (November 2022 – July 2025)
June–August 2023: ~25% correction (from ~$31,000 to ~$23,000)
April–July 2024: ~30% correction (from ~$73,000 to ~$50,000, post-halving dip)
February–April 2025: ~20% correction (from ~$112,000 to ~$90,000, based on X sentiment)
Similarities with Previous Cycles
Duration to Halving: The 514-day period from the bear market low to the halving aligns closely with the 513–542 days in previous cycles.
Post-Halving Bullish Momentum: Like the 2016 and 2020 halvings, the April 2024 halving preceded a significant price increase, with Bitcoin reaching ~$112,000 by January 2025 (a ~623% gain from the low).
Multiple Corrections: The current cycle has seen at least 3 corrections exceeding 20%, consistent with the 5–6 corrections in prior cycles.
Liquidity Correlation: The current cycle’s bull run aligns with global liquidity expansion (e.g., M2 growth from $102T to $107T by February 2025), similar to the 2016–2017 and 2020–2021 bull markets.
Differences from Previous Cycles
Lower Percentage Gain: The current cycle’s gain (623.83% to assumed peak) is lower than the 2015–2018 cycle (11,018.09%) and 2018–2022 cycle (2,064.22%), reflecting Bitcoin’s maturing market and higher starting price.
Influence of ETFs: The launch of U.S. spot Bitcoin ETFs in January 2024 bolstered demand, a new factor not present in prior cycles.
Supply Shocks: The release of long-dormant coins (e.g., Mt. Gox repayments, government seizures) in 2024 caused temporary oversold conditions, unique to this cycle.
Global Liquidity and Macroeconomic Analysis
U.S. M1 and M2 Money Supply Trends
M1 Money Supply (cash, checking deposits): M1 surged during the COVID-19 stimulus in 2020, peaking at ~$20T in 2021, but has since stabilized at ~$18T by mid-2025 due to tighter monetary policy.
M2 Money Supply (M1 + savings deposits, money market accounts): Global M2 grew from $102T to $107T between January and February 2025 (3.8% increase), signaling renewed liquidity expansion. U.S. M2 specifically has shown slower growth since 2022, correlating with Bitcoin’s bear market bottom, but recent upticks align with Bitcoin’s rally to $119,556.82.
Historical Correlation: Bitcoin’s bull markets (2016–2017, 2020–2021) coincided with rapid M2 growth, while bear markets (2018, 2022) aligned with M2 contractions. The current cycle’s rally since 2023 mirrors rising M2 year-on-year growth.
U.S. Money Printing and Interest Rates
Money Printing: Quantitative easing (QE) during 2020–2021 (e.g., $4T in U.S. stimulus) fueled Bitcoin’s 2020–2021 bull run. Since 2022, the Federal Reserve shifted to quantitative tightening (QT), reducing liquidity, but recent expectations of rate cuts in 2025 have spurred M2 growth and Bitcoin’s price recovery.
U.S. Interest Rates: The Federal Reserve raised rates from 0% to ~5.5% between 2022–2023 to combat inflation, correlating with Bitcoin’s 2022 bear market. Speculation of rate cuts in mid-2025 (potentially to 3–4%) has boosted risk assets, including Bitcoin, as lower rates increase liquidity and investor risk appetite.
Correlation: Bitcoin has a ~0.94 long-term correlation with global liquidity (M2), with a 56–60 day lag between liquidity increases and price rises. Higher interest rates suppress Bitcoin’s price by reducing liquidity, while anticipated rate cuts in 2025 are driving bullish sentiment.
Stablecoin Liquidity
Stablecoin supply (e.g., USDT, USDC) is a crypto-native liquidity metric with a stronger short-term correlation to Bitcoin’s price than M2. Positive 28-day changes in stablecoin supply often signal accumulation phases, while sharp declines align with local tops. Current stablecoin supply growth supports Bitcoin’s upward trajectory in 2025.
Prediction for Current Cycle Peak
Historical patterns suggest Bitcoin peaks ~1,060–1,070 days from the bear market low (35 months), or ~12–18 months post-halving. Based on:
Cycle Low: November 21, 2022
Historical Peak Timing: 1,060–1,070 days (October–November 2025)
Post-Halving Timing: 12–18 months from April 19, 2024 (April–October 2025)
Current Trajectory: Bitcoin’s price at $119,556.82 (974 days from low) and MVRV Z-Score <1 suggest further upside potential.
Speculative Peak Prediction: Bitcoin may peak between late Q3 and early Q4 2025 (September–November 2025), potentially reaching $150,000–$320,000, based on historical MVRV ratios (peak MVRV ~8) and liquidity trends. Risks include global recession, equity market corrections, or regulatory shocks.
Additional Pertinent Data
MVRV Z-Score: Currently <1, indicating undervaluation and room for growth compared to historical peaks (MVRV >3).
Net Unrealized Profit and Loss (NUPL): The current cycle is in the “Belief” stage, transitioning toward “Euphoria,” consistent with prior bull runs.
Exchange Reserves: Declining Bitcoin reserves on exchanges (e.g., CryptoQuant data) indicate HODLing, reducing available supply and supporting price increases.
Google Search Trends: Interest in “Bitcoin” and “crypto” peaked in prior cycles (2017, 2021) during bull runs. Current search volume is rising but below 2021 levels, suggesting the cycle may not yet be at its peak.
Correlation with Risk Assets: Bitcoin’s correlation with the S&P 500 and Nasdaq reached 0.73–0.76 in April 2025, reflecting its sensitivity to broader market sentiment.
Conclusion
The 2015–2018 and 2018–2022 cycles share structural similarities (4-year duration, halving-driven bull runs, severe bear markets), but differ in scale and drivers. The current cycle (2022–present) mirrors past cycles in timing and liquidity correlation, with unique factors like ETFs and supply shocks. Global liquidity, particularly M2 and stablecoin supply, remains a key driver, amplified by anticipated U.S. rate cuts in 2025. Bitcoin’s current price ($119,556.82) and metrics suggest a peak in September–November 2025, potentially at $150,000–$320,000, though external risks could alter this trajectory. Investors should monitor MVRV, NUPL, and liquidity trends for intra-cycle positioning.
As you can see this is a much more comprehensive analysis of the Bitcoin 4-year market cycle than my previous analysis. That being said the end result, at least when it comes to elapsed time similarities was about the same. It's obvious that for whatever reason the past two market cycles are amazingly similar in elapsed time. Moving forward it will be very interesting to watch as the rest of this current market cycle plays out. The major questions yet to be answered include. When will the market cycle peak occur? What will be the peak price? What will be the price of the next bear market low?
Looking at the price chart, especially when you view a line chart it is obvious that as Bitcoin ages as an asset, price volatility diminishes. Will this continue? Only time will tell. One thing that is undeniable is this has been an exciting and at times a frustrating market cycle. However, whether it is exciting or frustrating I am very thankful to be involved in it. I realize that this is a fairly long read so if you have made it this far, thank you! I really appreciate everyone who takes the time to read my ideas. Stay safe and get ready for a wild ride over the next five to six months.
Livermore’s Speculative Blueprint: Are We Near the Final Act?Livermore’s Speculative Blueprint: Are We Near the Final Act?
Bitcoin’s price action since 2022 eerily mirrors Jesse Livermore’s legendary “Speculative Chart,” a timeless model of market psychology and price behavior. The attached overlay illustrates how BTC has respected nearly every phase—accumulation, markup, reaction, and reaccumulation—leading us to what might be the most explosive stage yet: the vertical move from Point 8 to 10.
📈 The Setup So Far:
• Points 1 to 7: Clear accumulation and steady breakout patterns within a widening mouth structure—exactly as Livermore described.
• Point 8 (Now?): BTC breaks out of the upper resistance line, aligning with Livermore’s “all-important action” area.
• What’s Next? Point 9 and 10—typically a euphoric, parabolic blow-off top before distribution sets in.
🧠 Psychology Meets Price
Each leg of this journey isn’t just about price—it’s about crowd behavior:
• From fear to disbelief (Points 1–3),
• Hope to confidence (Points 4–6),
• And now possibly greed turning into euphoria (Points 8–10).
🕰️ Historical Echoes?
If BTC truly follows Livermore’s script, we may be entering the final markup before the inevitable distribution and reversal.
🧭 Key Levels to Watch:
• 200K+ may represent the speculative climax.
• A rejection from that zone could initiate Points 11–14, characterized by distribution and eventual breakdown.
• Long-term holders: brace for volatility.
• Traders: this is where legends are made—or unmade.
⸻
📌 Final Thought:
This isn’t just TA. It’s a battle between emotion and logic, euphoria and fear, and it’s playing out on the grandest digital stage of our time. Will Bitcoin complete the Livermore pattern? Bookmark this chart, follow the story, and let’s find out.

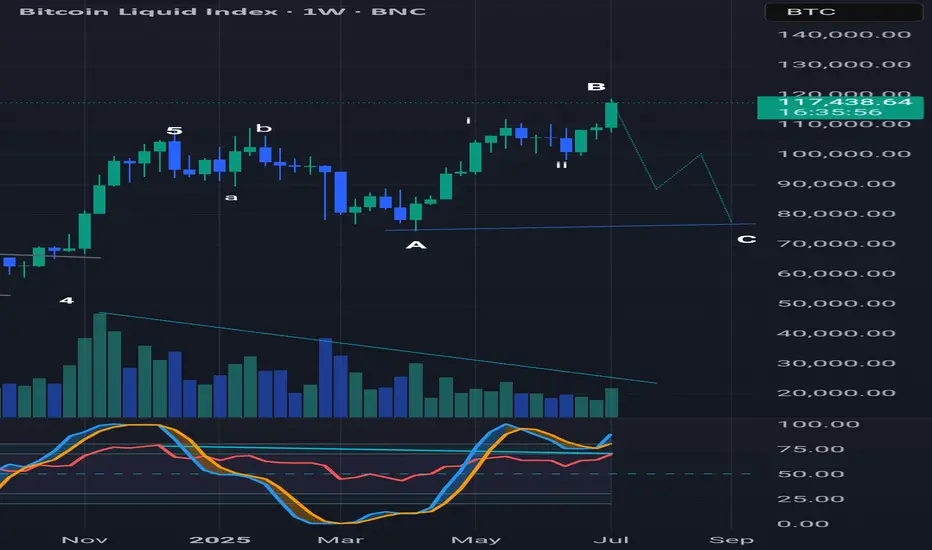
Running flat? Weekly chart wave analysisA running flat is where the B wave exceeds the starting point of wave A and the subsequent drop of wave C does not exceed the wave A low. Also note the declining volume and bearish divergence with the RSI on the weekly (and monthly) chart suggesting this move up is losing momentum.
The Final Parabola: What History Says About Bitcoin’s July MovesIf you’ve been following here for a while, you know we’ve been nearly pinpoint in calling all the moves for Bitcoin. The altcoin market, not so much, but check out previous TAs to catch up on my perspective.
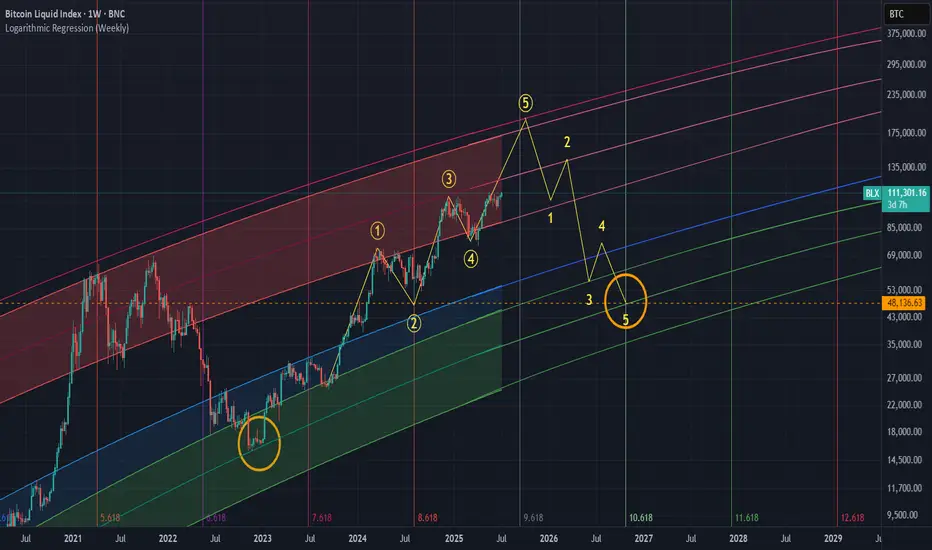
The two wave counts you see on the main chart have been in place for many months, I believe since around October 2024. As you can see, things have been playing out perfectly so far. The four year cycle continues to follow its path.
If the same thing happens this cycle like the last two, we should see a top sometime between October and December 2025, anywhere from 185K to 225K, followed by a cycle low somewhere around 48K in October 2026.
Bitcoin’s Julys
Every July during the 4th cycle year, Bitcoin begins its final parabolic run. This has happened without fail since the beginning of the Bitcoin Index chart. July consistently marks a major bottom, and then it's off to the races. The “only up” period that follows typically lasts 4 to 6 months and happens just once every four years like clockwork.
Here we are once again, the 4th year of the cycle, in July. Bitcoin has just hit all time highs and we've had a Hash Ribbon buy signal.
The perfect storm is brewing. Like always, the stars align in the second half of the 4th year of the Bitcoin cycle.
Time Cycles and Fibs
Looking at this time wave chart, we can see that every two waves like clockwork have marked a top. The next major wave appears to land in December 2025.
If we zoom into this smaller time wave, it has pinpointed the bottom of every small wave so far. The fact that we are once again at a bottom in July during the 4th year of the Bitcoin cycle is just another sign of the magical stars aligning.
This smaller Fibonacci sequence I’ve been tracking has already hit twice and predicted two major moves. The next dates to watch are August 2025 and January 2026.
There’s plenty of talk about an extended cycle. But during the last bull run, many traders and analysts said the same thing. In the end, Bitcoin topped out at exactly the same timeframe as the previous cycles.
If we reach the top of this model in Q4 2025, and we see a Pi Cycle Top signal along with a Mayer Multiple over 2.0, that will be our trigger.
If you've been sidelined this entire time, it's now or never. You don’t want to be the one buying in at 185K in Q4 2025 when everyone is calling for a million dollars. The time to act is now.
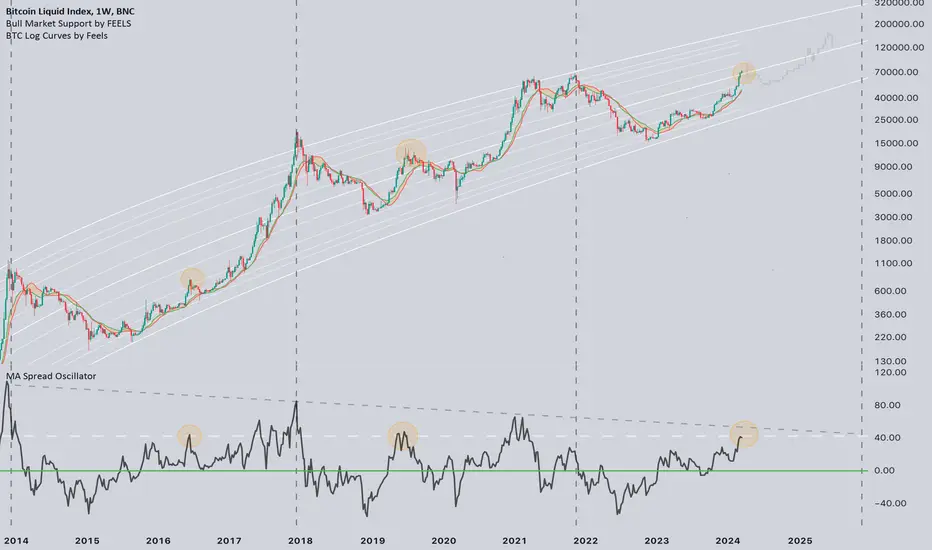
BTC reached the local peak? 👀#Bitcoin distance from BMS
Below is the oscillator, which shows how far the price has moved away from the bull market support. Mostly when we are in the 2-3 year of the cycle, the mark on the oscillator 40 acts as resistance, which indicates a mid-cycle peak.
Can it be different this time?🤔
Let's imagine that the CRYPTOCAP:BTC ETF inflow will be greater and distort the situation, in this case, we have a second trend line that indicates a global peak, which, by the way, becomes lower every cycle, now this mark is around ~50 on the oscillator or 80k on the price chart. You can consider this mark a best-case scenario for a local peak.
💡Remember, a good investor does not rely on one scenario but is ready for any.
BIG BEAUTIFUL BILL - Markets are Ready to PUMP Again! At the 4th of July, the Independence Day, the "One Big Beautiful Bill Act" was signed into law by President Trump. In this idea I want to take a closer look at some points of this law and explain why I consider it VERY bullish for most of financial markets, and especially for crypto.
Here are some key points of the law:
Raises the U.S. debt ceiling by $5 trillion, the largest single increase in U.S. history
Makes many Trump-era 2017 tax cuts permanent: keeps lower individual tax rates, preserves expanded standard deduction, retains corporate tax rate at 21%
Introduces new tax breaks: increases Child Tax Credit, exempts tips, overtime, and Social Security from federal income tax (with limitations)
Adds ~$150 billion to defense and another $150 billion toward border enforcement, including massive ICE budget increase
Trims SNAP food aid by ~$186–200 billion, tightening eligibility (e.g. raising work‑requirement age)
What changes can happen in the economy? Big tax breaks combined with increased expenses cause the growth of financial deficit, the projected by CBO deficit can reach $3 trillion. In this situation the only solution is increasing the national debt which makes Interest Rates climb higher (Yale’s Budget Lab forecasts a 1.2 pp increase in the 10‑year yield).
Why do I think this is bullish for most of stocks and mainly for crypto?
The increase of debt ceiling has always had a positive impact on the crypto and namely on $BTC. The best example is Fiscal Responsibility Act that was signed back in June 5, 2023. This act increased the debt ceiling for +$4.7 billion, after that Bitcoin surged upwards from $25,000 to $75,000 in ~half a year. Similar outcome can be expected now too.
Market perceives U.S. fiscal loosening as inflationary and dollar-weakening, making Bitcoin (as a decentralized and limited-supply asset) more attractive. TVC:DXY has already shown signs of weakness.
Large deficits often force future monetary easing or Fed bond buying to absorb debt. Lower interest rates and more liquidity are historically bullish for risk assets, including crypto.
Rising yields and bond sell-offs spook traditional markets. In this situation, Bitcoin becomes an attractive uncorrelated hedge for portfolios amid volatility in traditional assets.
To sum up , I believe the Big Beautiful Law is, to put it mildly, not good for US economy. However, local effects on stock & crypto markets can be considered positive for investors & traders. With this said, I believe we can expect CRYPTOCAP:BTC to reach $150,000 goal this year and mark this milestone as an ATH for the current bull cycle.

Hash rate capitulationThe hash rate capitulation (HRC) indicator used in the Bitcoin Bottom Indictor (BBI) has fired. The HRC indicator measures the rate of change of the hash rate. Steadily increasing hash rate is a sign of health of the bitcoin network. This indicator uses moving averages (20- and 100-day) of the hash rate to indicate when a decrease in the rate of change is has occurred (i.e., the 20-day MA goes below the 100-day MA). This indicator triggers when the 20-day moving average of the hash rate going below the 100-day moving average. In the past, this indicator has detected local and macro cycle bottoms. It does fire more often than most other bottom indicators, so take it with a grain of salt.

Bitcoin Log Regression 👀#Bitcoin Log Regression 👀
The orange line, as in the previous cycle, offers strong resistance.
💡I think CRYPTOCAP:BTC will stay at the current mark for another month. After that, we go to the correction, most likely it will not be a deep correction, but rather a consolidation.
This is indicated by overbought and seasonality.
⛏️ And also the capitulation of miners after the halving is possible, this will lead to a decrease in the hashrate, which will slow down the growth for some time. But do not be sad, the bull market will continue closer to autumn↗️

Bitcoin: Higher Degree Wave DimensionsA new long-term pattern has been identified. Essentially a stretched version of the chart shown here:
This resemblance holds to some extent, as the coordinates are anchored to relatively longer cycles:https://www.tradingview.com/x/PUxSDlLx/
Publishing this one in raw form (intentionally minimal) just to document a recurring structure across extended timeframes.

We are heading here12k is the average price of the market at the moment. we might 14x / 24x (depending on where you are starting) in the next ten years. BTC will be at around 200k $ at that time.


Bearish Logaritmic Regression AnalysisResume
This advanced logarithmic regression predicts we are about to reach top in the middle-late June. To start a bearish long term trend.
Discussion Analysis:
To extrapolate the current logarithmic regression trend. I tried to fit a sinusoidal wave to the logarithmic regression trend. The fitted Sin Wave is in dotted purple color when LogReg Trend is in green (bullish) phase right now. The logarithmic regression also is applied as deviation factors in Fibonacci channel terms (green and red transparent bands in the background).
Current status: we are already in a red (should sell) Fib. area which is a high risk scenario in the Log Reg. A higher risk region would be seen if the price pass to the last red section, where we would see the highest volatility for this cycle, before sudden, sharp declines.
I don't think we will reach the highest section of the Fibonacci Log. Reg. Channels. The only way we still could get there is if the fundamentals change dramatically: If FED drops the rates, if Trump stops the market wars, etc. Nobody knows. I think that may play out maybe at the end of the summer.
DISCLAIMER
This is not financial advice. I own several cryptocurrencies. This is only my mere opinion. Do your own research!
Good Luck.
Thor.

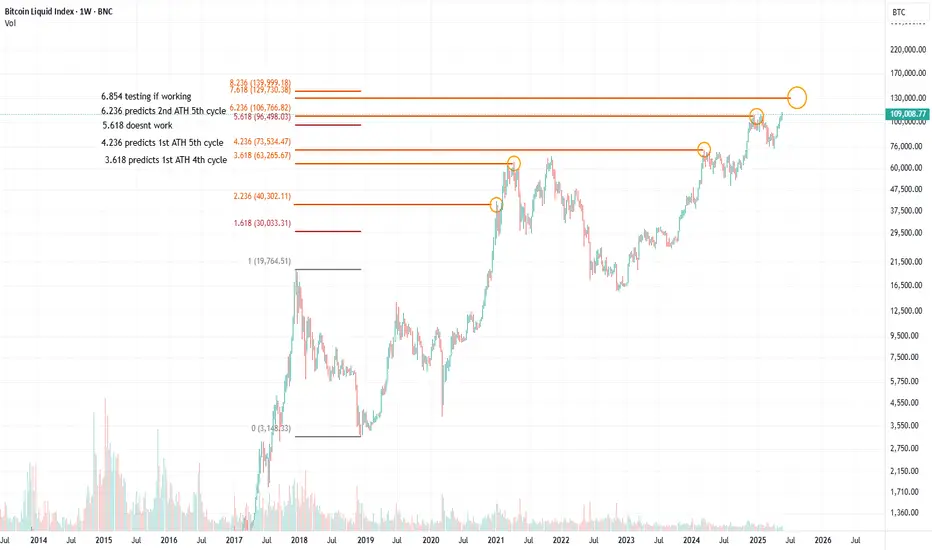
BITCOIN IS A SOLVED GAME. AND I SOLVED IT WITH 1 FIB PULLOne single fib pull to rule them all. From top to bottom in 2018 we can clearly see how many significant levels we get:
The 2.236 level gives us the first ATH in 2021. After that we face a 30% pullback.
The 3.618 level gives us the 63k top in 2021, again to the absolute dollar.
The 4.236 level gives us the first ATH of 2024, after which we faced 230+ days of sideway nothingness.
The 6.236 level gives us the exact ATH at the end of 2024
Following the logic of these numbers the next levels we should look for are: 7.618 and 8.236
Inverse DXY 3-months forward suggests Bitcoin top early JulyInverse 3-months forward DXY (blue) seems to guide Bitcoin, and if the current DXY low holds, Bitcoin might top in early July. This idea is corroborated by The 2024-2028 Bitcoin cycle in grey, which bottomed and topped out within a similar timespan. It is also confirmed by Lars von Thienen's observation, that Bitcoin has 5 200D cycles each bull run www.youtube.com

Halftime For Bitcoin [BTC] [PiCycle] [2YMA]Let us be curious whether the Pi-Cycle-Top-Indicator and the 2YMA hit again this time. Maybe "this time is different". But most likely - as always - not.
I watch BTC to cross PI350. And you?

Bitcoin Halving CyclesBitcoin halving cycles chart with signficant bear market lows and highs marked. Bull, bear and consolidation phases noted in red, green and orange.

Predicting the Next Bitcoin 200MA Peak Using Exponential DecayIn my ongoing study of Bitcoin market cycles, I noticed a compelling pattern in the behavior of the 200-day moving average (200MA) across bull markets. Specifically, I observed that the percentage rise of the 200MA from each cycle bottom to cycle top is decreasing over time, and this decline follows an exponential decay pattern.
Historical Observations:
• 2015 Cycle Bottom to 2017 Peak:
The 200MA increased by approximately +686%
• 2018 Cycle Bottom to 2021 Peak:
The 200MA increased by approximately +450%
This pattern suggested to me that the next peak in the 200MA might continue this decaying trajectory. To estimate this, I applied a simple exponential decay model using the two previous data points:
y(t) = A.e^{-kt}
Solving for the next value (t = 2), the model predicts an approximate increase of +296% in the 200MA from the current cycle bottom to the expected peak.
Implication for the Current Cycle:
Assuming the 200MA bottomed around $16,200, a +296% rise implies a target 200MA near:
$16,200 x (1 + 2.96) is approx. $64,000
This aligns remarkably well with the 2021 bull market top, reinforcing the idea that the previous all-time high (~ GETTEX:64K –$69K) could serve as a strong macro support level once this cycle matures.
Conclusion:
If this exponential decay pattern continues, we can expect the 200MA to peak around $64,000 during the current bull cycle. This target also coincides with historical resistance turned potential support, making it a critical level for long-term investors and swing traders alike.
This type of decay-based modeling, while not exact, offers a unique lens through which we can assess Bitcoin’s macro behavior across cycles. I’ll continue to monitor how this projection plays out and refine the model with new data as the market evolves.
