Not a Financial advice BUT MAYBE a Financial repetitionCould be disputed, Could be wrong, depending on which theory you believe in.
it has never been, and doesn't have to always be, but it was.
So what will it be ? it could be what will be !
BLX trade ideas

Bitcoin's Negative Correlation with US Dollar Index It is already pretty obvious to any analyst - a stronger dollar means a weaker crypto or stock market, and a weaker dollar trends toward stronger crypto and stock markets.
As you can see on the chart, Bitcoin (BLX) has a crystal clear negative correlation with the US Dollar Index (DXY), as expected. So, why am I talking about it?
Each time DXY has peaked, BLX has made a new low, and vice versa. A large majority of these major milestones first occur on DXY, prior to following in the opposite direction with Bitcoin. There is one exception noted above during the March 2020 black swan event, where DXY peaked after Bitcoin and stock markets bottomed. Otherwise, most of these events happen first on DXY, and then markets follow.
Presently, DXY has closed its weekly candle above the neckline of a confirmed head & shoulders pattern. Is this just a pullback, or are we headed towards ~105-106 and a failed HS?
If you zoom out on DXY's monthly chart, it looks more like a bullish re-test of a breakout, but still possible it moves back down into the 90s:
Conclusion:
Can we use this assumption again now: that DXY can an early indicator in determining direction of Bitcoin and the crypto/stock markets as a whole?

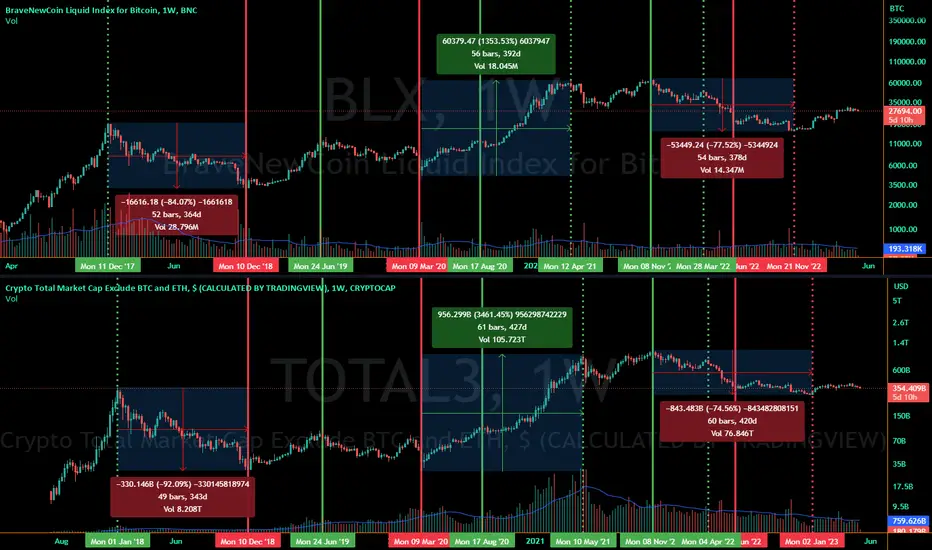
Growth/Losses of All Altcoins Excluding Eth vs. BitcoinHere's a look at major peaks and valleys in Bitcoin and Total3 (total altcoin market excluding Ethereum) starting from the Dec 2017 peak until now. First, a key to follow along:
Key:
- Solid Green/Red Lines = Peaks/Valleys occurring during the same week or day between both markets
- Dotted Green/Red Lines = Peaks/Valleys where dates deviate between the two markets
Traditionally peaks and valleys have happened around the same time, sometimes with minor deviation where altcoin market's peak or valley occurs shortly after Bitcoin's, if not on the same week or day, and altcoins as a whole have typically shown stronger losses than Bitcoin from peak to valley, in the past.
After the 2017/18 peaks, Total3 lost more, in less time, than Bitcoin. It peaked a few weeks later and then bottomed on the same week.
More recently, that deviation has grown in length and changed in scope. Here's how:
March 2020 low through the April/May peak:
--Total3 moved stronger and for longer (by just under a month) than Bitcoin. It typically does move stronger, but moves tend to end nearer to each other than what happened here.
November 2021 ATH to our most recent ATL:
-- Despite many alts having steeper losses than Bitcoin, as a whole Total3 lost approximately 3% less than Bitcoin and its valley occurred 6 weeks after Bitcoin's. In this case, it moved weaker than Bitcoin and has shown the longest deviation in the time it took to do so.
About a month ago, around April 13th, Bitcoin made a new local high. Altcoins haven't yet followed. Interesting, right?
That said, we still don't know for sure whether Bitcoin is headed towards a new peak or a new valley. Let's see how this plays out.
$BTC - BULL Cycle CONFIRMED - $500,000+ by 2026Bitcoin BULL CYCLE 🐂Confirmed
1 BTC = 500,000+ by 2026
World Economic changes are in favor of #Bitcoin
Regulations, ETFs, Payments etc.
#BTC will become $10T Marketcap
#Ethereum will be $5T

BLX/USD Bitcoin on the weekly candleI think we will continue in the sideways wave until November 25th, and the bottom will be at 21750 for this wave. Then, the rise will begin to break the previous top, which is 69,000

BTCUSDT WEEKLY Analysis May 12, 2023There will always be volatility with BNC:BLX Bitcoin and the CRYPTOCAP:TOTAL Crypto space. We are still accumulating at these levels. Hopefully this chart will ease your worry and stress. We are in good shape.
Still Bullish on the Weekly! #FollowTheSignals
Not Financial Advice...Trade with Confidence and Control.

Bitcoin rainbowwww.tradingview.com Back in the purple again. Hopefully this means the end of the current mini bear market. Maybe this is a trend of less volatility with subsequent 4 year cycles. A 60% drop instead of 80% like in 2018.

Maybe the bull market isn't over?The timing is not consistent with past cycles for the current bull cycle to be over. There may be more to come, but who is to say? Regardless, there must be a significant uptrend shortly (within the next 3 months) if the bull is not dead.

Bitcoin price spends majority of time in the "fire sale" band.Just eyeballing it, looks like the BTC price spends most of the time in the lowest band of the rainbow. The rest of the time it is transitioning by either escaping from it and going to the moon, or coming back to earth.

BTCUSD to $333,333 by mid-2025Fib retracements for each major phase since the beginning. Each phase has corresponding fib retracement levels to previous phase.
For example 0.786 of each phase aligns with 0.236 of the preceding phase.
If this plays out again, it would suggest the next major top at around $333,333.33 (approximately) for BITSTAMP:BTCUSD
Furthermore, Fib Time Zone extensions suggests possible time frame for next major price point to be around mid 2025.
Note: All Fib levels have been drawn for personal musings and entertainment, definitely not to be taken as financial advice.

Bitcoin Price projection similar to 2016-17 bull runOf course, this is only a projection and it is possible this may not play out. Chart is based on PI cycle tops and bottoms. Good luck and always use stops.

Lengthening Elliot waves cyclesThis theory suggests that elliot wave cycles are lengthening, this can co-exsist with the 4 year cycle of the bitcoin halving.
The key difference is that we should get an extension in the 5th wave(blow-off top) this 4 year cycle.
Looking at past cycles, the 5th wave was also the strongest move so yes we could have an greater rally than in 2020/2021.
If we get an equal rally in %-wise like in 2020/2021 we get an measurement of 1600% from 15k to 250k
And if the 5th wave goes beyond the 3th wave you get some crazy targets in an short period of time (blow-off top)
If this theory is correct this could back up some crazy btc targets because this is the first cycle when we already made an new all time high in the 3th wave compare to other cycles only in the 5th wave.
Yes it took longer to get there but thats the theory that each cycle will take more time to fininsh
In the charts below when you measure the bottom from an complete elliot wave to the next you get some data that suggests lenghtening elliot wave cycles
Cycle 1:
Cycle 2:
Cycle 3:
Cycle 4:

Btc Long term playHypothetical next btc top. My trend analysis. Btc on the 1 week. 4 year cycle theory

Bitcoin - BTC and if TRIX indicator🔹crosses its Zero-line🟡Bitcoin
After 2015 and 2019 the "bottom is in" should be verified at the very latest when the TRIX indicator🔹crosses its Zero-line🟡
Will keep you up to date dear BTC and Crypto Nation👀
Comments💭, Love ♥️ and Follow🔗appreciated🤗
Let me know your thoughts in the comments🤗
⬇️⬇️⬇️
Likes and Follow for updates appreciated🤗
Disclaimer:
Not financial advice
Do your own research before investing
The content shared is for educational purposes only and is my personal opinion

Bitcoin BTC Bull Market Golden CrossBitcoin BTC bull market golden cross, 5-day moving average MA10 crosses MA100 golden cross, this golden cross also appeared golden cross signal in the past bull market, 2012 bull market golden cross, 2015 bull market golden cross, 2019 bull market golden cross, 2020 bull market golden cross Fork, 2023 bull market golden fork again, such an obvious signal is right in front of you, what you do is people who don’t believe it, life and death are bearish, if you don’t accept it, you will do it, only the blind will not see the bull market golden fork, blow up the short, get rich and long, in the middle Satoshi Ben said: If you don’t understand or don’t believe it, I’m sorry, I don’t have time to convince you. The starting point of the bull market surge is on the moving average in front of you. The bull market is coming, and the point of the sword is invincible.

The Bitcoin Event Of 2023The Next Big Bitcoin Event
Its getting to that time again the next Fib time sequence is around the corner, for months I have been going on about the next date, the last week of June 2023. Last year we managed to predict the biggest move of 2022 end of May/June 2022.
I would say I was pretty dam close and if you look at the date of that publication that was January 2022 so months before this timeframe, I already knew the outcome and it was all because of this Fib time sequence I have been using for over a year now.
When it comes to technical analysis I focus a lot on time, I think time is the key to be ahead when these macro pivots come and so far on a macro timeframe, we been successful since the start of 2022. The Fibonacci time sequence you see the main chart about is one I’m currently following closely even though is not the one, I have been following for over a year it still lines up to last week of June 2023.
If we look at the last cycle when can see that the timeframe between 0.5-0.618 happen to be a major pivot.
If we zoom in, we can see how closely 2019 its following, if we continue mirroring then its possible we see 38k top by end of June 2023 and come May 8th (0.5 Fib) we shall start seeing the pivot to the upside. Many traders are pointing to a retest of the top of previous resistance which was 25k , I think that is also possible but we would have to close above the 0.382 fib Fan to keep this rally alive , so a wick down to 25k and a close above 26k , just like it did march 6th 2023 with that massive weekly candle wick.
This date May 8th is lines up closely with the next FOMC meeting where will see what rate hike we will get if we get a pause, it would be setting up perfectly for one leg up, history shows that pauses cause short term rallies which are then followed by massive drops.
USDT dominance broke and closed above the 2/1 Gann Fann that I was watching closely which is not a good sign at all , if Bitcoin did wick to 25k then its most likely USDT would go up to the 3/1 Gann fan which is where it got rejected last time again march 6th 2023.
The bump and run that took Bitcoin out of a bear market last cycle gave us the pico top at 13.8k which was the 0.618 , this was the technical breakout target of the bump and run reversal
So this is where things getting interesting, the technical breakout target of this years bump and run that did the same thing as last cycle, took us out of a bear market is 60k , that’s right folks that’s the target of this Marco pattern.
So now to the doom and gloom the red dashed projection on the main chart. Every cycle we make a Marco double bottom , it will be a black swan event , last cycle it was covid this cycle war/banking etc many catalysts out there pick one , here it does not matter if it comes we go in heavy because we will be expecting it.
As you can see the double bottom happens before the halving event always and we are about 300days off the next which is in April 2024 so it is possible that we get the “pivot” for the crash coming last week of June 2023 if we keep on making lower lows on the daily week after week.
This year it is definitely much harder to call a direction, most of the market thinks we have plenty of time to move up but for me its 60days for the move whether is up or down it all depends for me on holding that 0.382 fan fib , we start closing under it come end of June then red projection is likely to play out , one thing for sure coming into this timeframe things are going to get crazy.

Thoughts on this fractal pattern?I can't believe the similarity in these patterns, being bitcoin I guess anything is possible and if it was to play out it would shake up a lot of the weak hands.

BLX Still Shows A Broken Trend And Slower Growth For BitcoinZoomed in, you can see price is butting right up against that broken long term trendline, while the weekly oscillator is reaching the overbought zone. Price has also yet to reach the bottom of the curved channel (pink)
The BLX chart is also mostly dominated by sell volume. Another odd thing to note is the enormous spike in volume on stablecoin traded pairs throughout the market turmoil, and specifically during the week of the SVB collapse. Even more perplexing is the huge drop off in volume as Bitcoin began to trade mostly sideways after that. Here's the Binance BTC/USDT chart as an example
If Bitcoin is to touch the bottom of the curve on my BLX chart, we could see a retest of the $15.5k low at minimum. My guess is that Bitcoin will ultimately fall out of the growth curve and trend lower over time. I made a speculative downtrend channel, giving Bitcoin perhaps a few more weeks of sideways and a possible new failed high. Due to the nature of Bitcoin's support (in that it is essentially an idea), it is unlikely to drop instantly to zero, but instead trend lower and lower as people lose interest over time.
Most still in the market seem to be bullish right now, already making projections for the next bull run. It's important to note that while SPX is still above 4000, Bitcoin is less than half of its all time high. Should traditional markets experience a more significant decline, I cannot imagine there would be enough liquidity to sustain another Bitcoin bull run. But....we live in strange times. It's perfectly possible that I'm completely off here. Nevertheless, I'm sticking to my view for fundamental reasons. If Bitcoin continues onwards to a new all time high, I don't think it'll be accompanied by anything good...though I suppose that's part of the bullish Bitcoin thesis :)
As always, this is my opinion only and should not be taken as financial advice. This is meant for speculation and entertainment.

BTC Long term analysis BTC Long term analysis....
Now we are In falling channel....
If we break out channel this will be huge bullish sign...
Possible pullbacks from the top of the Channel

$BTC is the correction over, or do we grind higher?Been expecting a 3 wave move in this bear market formed of 5 waves down, 3 waves correction, final 5 waves down.
Not sure it is quite over yet and sentiment is that if the $32400 area is broken we have confirmation of a new bullmarket.
Indicators are suggesting we are more likely near a top than a new bullmarket based on:
Stoch RSI forming a double top pattern at extremes -: note, crossover not confirmed yet
Williams Vix in the low sell band
LMacd declining green bars divergence -: note, no moving average crossover yet
In my opinion, price can stretch higher and I will only look to short either:
A) when all 3 indicators are flashing at the same time to sell (awaiting the crossovers)
B) price enters my shorting zone marked in the rectangle
TVC:DXY having alot of fake-outs, but looks like it is building a bottom structure again
Natural Gas and Crude Oil are breaking out, which is a forward indicator of inflation surging again and therefore continuation of the bear market.
Selling pressure can come in May also from Gemini and DCG fud as well as US dumping silk road bitcoin

BLXUSDWeekly Bearish Divergence setting up for the Bitcoin sale of 2023. Possible triple bottom and then slow an steady growth.

90k Bitcoin by Dec 2023?2023 looks like it will be bullish.
Is it possible that that Bitcoin could reach 90k by late 2023 or even early 2024? Yes anything is possible, however it's not likely. What is likely is the beginning of the new bull market (March/April) is what I believe. Until then, we will only see small movements with volatility growing upward into second quarter of 2023.
The Stochastic RSI on the monthly has never had a false signal and historical marked the beginning of the Bull market.
Only time will tell, Invest responsible.
This is by no means investment advice.

Wall Street Cheat Sheet Psychology of a Market Cycle on BitcoinWall Street Cheat Sheet Psychology of a Market Cycle is a very famous one among traders and investors. While this sheet was made with the intention of Stock Market, I see it's been used much in Crypto world as well.
In this chart I try to plot the respective psychological stages in the chart it self based on my interaction with local traders/investors. This is not an accurate as it's only reflects my personal view. Anyone can interpret this differently based on their social sentiment.
Something additional I have added are;
Line of Disbelief: This line indicates a price point where many people will have a disbelief of the price action
Line of Hope: This line indicates a price point where many people will move from Disbelief to Hope
Credits: wallstcheatsheet for building
Hope you liked it, as always share your views and criticism.
