Everyone thinks the Bullmarket is BACK! ... but it isn't.BTC DOUBLE topped for the first time in its history. People expect there to only be ONE downtrend from the top... well reality is about to hit the bulls hard when the yield curve un-inverts and rates get cut. Don't believe me? Research those concepts for yourself and make a decision. It's different this time. You've been warned.
BLX trade ideas

BTCUSD - Run to 700KAn idea for BTCUSD showing extreme growth during a strong bull market
this is an extension to 2.618 of the previous rally's bear market
Large continuation pattern

Bitcoin is so bullishBitcoin appears to have entered a bull market phase, which is characterized by an upward trend in prices over an extended period. While some traders may be focused on short-term gains, it is important to remember that in bull markets, the best strategy is often to hold onto your investments for the long term.
Short-term trading can be tempting, but it can also be risky. In a bull market, prices can be volatile and unpredictable, making it difficult to accurately time trades and exit at the right moment. Additionally, short-term traders are more susceptible to market fluctuations and can be easily shaken out of their positions by sudden drops in price.
On the other hand, investors who hold onto their Bitcoin for the long term are more likely to see consistent gains over time. While there may be some fluctuations in price, these are generally smoothed out over the long term, allowing investors to benefit from the overall upward trend in the market.
Of course, this does not mean that long-term investors should simply hold onto their Bitcoin without paying attention to market conditions. It is still important to monitor the market and make informed decisions about when to buy or sell. However, the focus should be on the long-term trends rather than short-term gains.
In conclusion, it is my belief that Bitcoin has entered a bull market and that investors who hold onto their investments for the long term are likely to see consistent gains over time. While short-term trading can be tempting, it is important to remember that in bull markets, the best strategy is often to hold onto your investments and ride out any fluctuations in price. As always, investors should carefully monitor market conditions and make informed decisions based on their own risk tolerance and investment goals.

Bitcoin FULL EW Model 🎯 🎯🎯BITSTAMP:BTCUSD
The PROOF is in the PUDDING
Beauty and the Beast
Its ALL in the charts, accurately nailing targets on BOTH sides, TOP & BOTTOM
Try find a TA on TV, YT or CT who has been THIS accurate
If you can't handle the bearish targets during correction, it means you ain't a true trader and don't got the guts or the balls.
Real traders bank profits on BOTH sides of the trade, not just during 'up-only' (so many got caught off-guard uptop above 60k yelling BTC 100k while the signals were all clearly there for over a month, just like during pre-may dump).
1 last & final leg missing to this beautiful beast, and if/when she starts to drip, sooooo many cryptomaniacs are going to be completely mind-blown & surprised
If you read this and saw my chart, then you now know what to be looking out for.
Good Luck

Bitcoin LongTerm Systematic Trade SetupBitcoin LongTerm Systematic Trade Setup
Max Drawdown Less than 25%
This is Systematic Trade Setup for Long-Term Investment (Months-Years)
We uses the Trend Based Fib Time tool along with Bitcoin fundamentals.
The maximum drawdown is under 25%, and both the long and short positions are based on macroeconomic data.
Back Test Stats (2019-2022)
Trade: 5
Win: 5
Lose: 0
Profit: 983%
The best Long position is the day that Bitcoin halved (May 2024 + Fib 2.618)
Profit: 559%

Why are you taking so much Stress?😉So I don't really see a lot of people talking about this on the Internet. Bob Loukas was the first who actually made a very Bold Statement that "Bitcoin usually follows a Three Year Bull Market Phase and then a Devastating Bear Market in the Final Fourth Year"
I have linked his Original vid in the end of this. Also except that 2010 Year if you just count BLX Chart on a Yearly Basis you can see how beautifully things have played for this Asset class. Now yes there will be a lot of No-Sayers about that Cycle doesn't work but just look at the Charts and see for yourself. Humans can lie at times, but Prices don't lie and it is clearly evident for your reference.
If we go by this Model (which has worked Three Times very accurately) the current low is at 15500k and this will be the final low, now it remains to be seen if we test that Dec lows of 2022 again. But even then Prices should not fall below 15,500 level.
According to this Model 2025 will be the final year of any Bullish Upside Momentum. We will see a lot more Optimistic Sentiment at that time right when the Top will occur. But for now i think we will continue Making Higher Highs and all that Nonsense Stuff...
Plus also it is much, much better to have a Swing Trading Approach so that you aren't just constantly Glued to Prices. Let's be Honest Trading can be a very challenging job plus it puts a lot of pressure on your Health, your own body to be right on every instance as I myself have tried in the past...
Listen, if you still want to Trade that is Perfectly fine even I do take occasionally Trades if I see any OPPORTUNITIES but have a Separate Account for that. "Grass is not always Greener" especially a lot of Fake Trading Gurus will tell you 'Buy my Freakin Course' 'Learn about this Crazy Indicator Setting', Trust me none of that will work. The Only thing works here is Having Patience, Believing in Yourself, Doing that Boring Thing, Learning and most importantly respecting the concept of Risk Management, Not having Emotional Attachment towards your Portfolio and also your Psychology I would say. Anyways if you have any questions regarding this let me know I will be more than happy to help you so that a lot of you could take advantage of this knowledge and won't mess unlike Previous Bear Market Rallies because Bear Market Rallies are Hard to catch and they do fool a lot of people if you been here in Trading/Investing you already know how Sharp they are. And thank you for reading all of this😊
Bob Loukas Original Vid Link : youtu.be

Expectations VS RealityReality is almost always a perfect inversion of common expectations when it comes to markets.

Bitcoin market cycles leading into 2025Here it is crypto fam. Here we have the market cycles for Bitcoin and in color. We begin with the year of the bull run then we have the bearmarket year then the year that no one likes which is the year of Pain. After pain we have the famous and most anticipated Bitcoin halving year then the most exciting time in crypto is the Bullrun year. We have had three of these cycles already and the fourth is coming upon us soon. Before we have fun though we will be going through the year of Pain this year because even though Bitcoin is climbimg beautifully now we are expecting another test to the bottom which we call Pain. The year of the halving in 2024 will be a great time to buy up your favorite projects and then when 2025 comes we have a beautiful Christmas.

45-48k Target, by May/July.Thinking echo bubble top plays out similar to previous cycle..
No guarantees of course..
My upside target is 45-48k my may/july this year..
As you can see, fib speed fan 0.75, 0.618 horizontal fib, and 0.75 time based fib all intersect and mark the local top.
The 0.5 is positioned where the bottom formed. The exact amount of time that it took from the 2017 top to the 2018 bottom, is repeated this cycle. 52 weeks.

Brave New Coin Bullish Target UpdateWith allot of overhead resistance forecasted it is fair to assume the next target to fall between $36500 & $39000 before we push onto $49500?
Note : all target based on PnF chart calculations!

Brave New Coin Bullish TargetsI find these charts very satisfying to the eye although working on round numbers most of the time!
Note the updates are somewhat delayed so cannot be relied upon in real time.

Predicting Bitcoin tops and bottoms using halving dates.I thought I will share with you what I found out. Apparently by measuring time from the halving you can more or less guess the bitcoin tops and bottoms and/or correction or dead cat bounce to safely sell what you got. This is not going to show you perfectly where to sell and where to buy but it is not for that, this is to help long term traders when to scale in and scale out of the market, regardless of the price. It can be hard, as you know everyone at the top screams for higher targets and at the bottom for lower. I hope this will help you out. And feel free to do a different measure of your own, Just put halving dates and start from there. Thanks!

Bitcoin next 4 year cycle top October 2025 $BTCBNC:BLX
Both the current bear market top to bottom and previous bear market is within the same timeframe within a 2 week candle. Both the last 2 bull markets lasted the same time within 2 weeks. Nearly eactly 50% through each bull market was the top of an automatic rally (Wyckoff AR) or key pivot RH3. This would put the top of the next automatic rally at May 2024 and the end of the bull market at Mid Oct 2025 4 year cycle

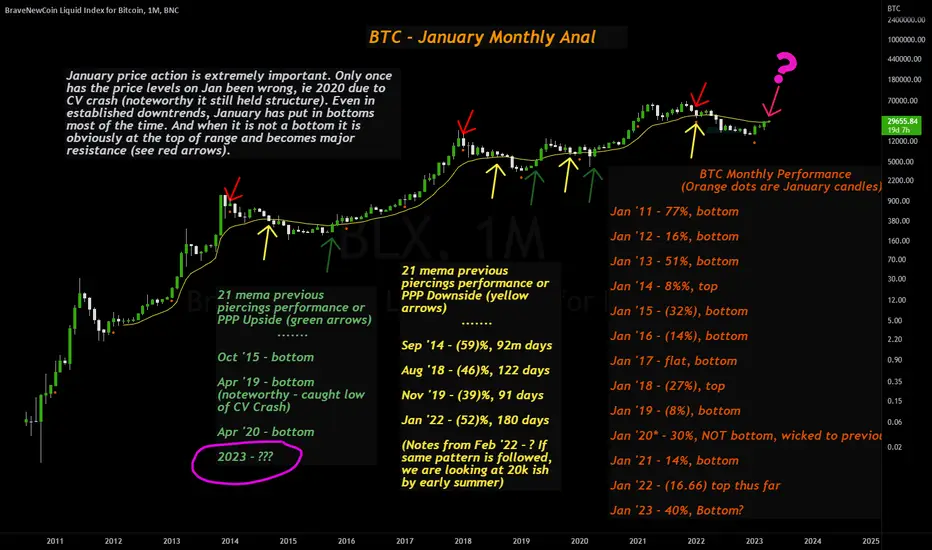
January BTC Analysis is playing out nicely so far for bulls.
If this monthly can close above the 27k handle, it will signal a very strong position for bulls. If you are unaware of how important January price action is, check out this nifty chart I made. Also listen to the streams we did at the beginning of February to hear some rants about it. The pink arrow is showing the current upside piercing attempt. The green arrows show the previous instances. The tables on the bottom show performance of all piercings, up and down. We are at the cusp of flipping into a bullish regime for crypto. Lets keep that popcorn out and see if they can confirm it on the highest of time frames.
Happy trading!
Time based fibs and historic trend lines predict $1M $BTC EOYTime based fibs and historic trend lines that have predicted every CRYPTOCAP:BTC top in its lifetime predict $1M CRYPTOCAP:BTC by November/December.
It is what it is.

Bitcoin time analysis cycle based on machine learningcycle Analysis this Should Happen in the Coming Years i will update it every week until the cycle in black color end good luck .

Rule No1. Law of Rythm $777
"Understanding the Law of Rhythm in trading means recognizing the natural ebb and flow of the markets. By adapting to the different cycles, traders can make more informed decisions and increase their chances of success. It's not just only about 'what goes up must come down' - it's about timing and strategy. #TradingTips #MarketCycles"
The Law of Rhythm is a trading law that states that the market moves in a rhythmic pattern, alternating between periods of expansion and contraction. This law suggests that markets, just like nature, have a natural ebb and flow.
According to the Law of Rhythm, traders should pay close attention to the current market cycle and adjust their trading strategies accordingly. This means that traders should be aware of the different stages of the market, such as the accumulation phase, markup phase, distribution phase, and markdown phase.
By understanding the Law of Rhythm and the various stages of the market, traders can make more informed trading decisions. For example, during the accumulation phase, traders may want to look for oversold securities that are likely to increase in value during the markup phase. Similarly, during the distribution phase, traders may want to consider short-selling overbought securities that are likely to decline in value during the markdown phase.
Overall, the Law of Rhythm emphasizes the importance of understanding the natural cycles of the market and using this knowledge to make more profitable trades.
In a Blackswan Event, I expect Bitcoin $ 777

💲BITCOIN💲 And its power of multiplication in a bull market!Hi guys, today I'm going to bring here some of my BITCOIN reading from a long-term perspective!
To be clearer with friends, we will only use an indicator called TSI = (True Strength Index)
And the Price of the asset illustrated by a bar chart.
See that whenever the price manages to have enough strength to make the TSI cross upwards, we have the beginning of a bull market.
It is clear that we have a lot of bad news in the market, and a lot of fear as well, but I must remember that good news reflects an already high price.
This bullish crossover is clear as daylight here and serves as a wake-up call for bears.
The more you deny a possible Bull Market, the further behind you will be!
In previous studies we also commented on how the Fibonacci time cycle, when plotted between each BTC miners reward break, indicated a buy window from the 0.618 point, these points were successful in the last bull cycles.
Knowing this, we have strong indications that the price may have marked a relevant bottom to start the next bull run 🚀.
So look at the power of multiplication that BTC has even without leverage, it's something amazing!
BTC in these last crossings would manage to multiply its capital by more than 230x to the peak of 2013, by more than 65x by the peak of 2017, and by more than 14x by the peak of 2021.
The question that remains is how many times do you think BTC will multiply now? Leave your opinion here in the comments!
Thank you for reading and I hope I have contributed, good trades!
Att: Leandro Sander.
🔴Disclaimer: The comments above reflect solely and exclusively my opinion, this is not a recommendation to buy or sell. Just a series of published studies, so that with the community we can discuss tactics and operational techniques.

Why would this time be different?The pattern is simple:
1. Top
2. Bear trend
3. Bullish pattern reversal breakout strongly
4. Retest (2015) or not (2019)
5. Consolidation
6. Echo Rally to 0.5 Fib
7. Decline and prepare for the base for the next halvening
Why would this time be different whilst we are at the consolidation phase in this cycle. Worst case scnenario restest of the base. I previously said 36k is a magnet. It is. That's the target of the iC&H that confirmed.
Now 42k is also a magnet.

The 30/120 EMA Bitcoin weekly chartTake a look at the chart.
This is using my own indicator that combines 2 EMA and gives it the best time to buy Bitcoin between the Green and Red Vertical lines as the 30 EMA crossed with the 120 EMA.
30 EMA Red
120 EMA GREEN
What can data can we gather from this chart:
1# Once the price is above the 120 EMA (GREEN) BITCOIN goes on a major Rally
2# The 30 EMA crossing beneath the 120 EMA marks the bottom for the cycle
3# Between the 2 crosses is the best time in the cycle to buy Bitcoin and take leverage
This indicator shows that the bottom has been reached and from now on Bitcoin will a bull run.
One thing we have to consider is that we usually test the 120 EMA (Green ) for a month before we break above it with a significant pump.

Trend until 2025? Bitcoin BLX macro trendlines and FibsAll lines are cloned from the orange trendline and seem to give nice medium- and long term support/resistance orientation.
Fibs in Log mode.
I guess, that in the coming months and years until my 4-year cycle target zone in Q4 2025, we might break below the lowest trendline in this chart.
Then, a new clone of the trendline might be applied.
"Happy Zone" end 2025 indicated :-)

Technical History on the Bitcoin Monthly chartReflecting on the history of Bitcoin, I've observed that there have only been a few instances when the price dipped below the 55 exponential moving average (EMA) on the monthly timeframe. I remember back in January 2015, there was a tiny wick below the 55 EMA. Then, in January 2019, we experienced our first candle close below it. Fast forward to July 2022, and we began to see several consecutive monthly closes below the 55 EMA, even before the FTX collapse.
After months of anticipation, I've noticed that Bitcoin has finally pushed above the 55 EMA for the first time in several months. This followed a whole month of consolidation right below it. Additionally, Bitcoin has managed to push above the 21 EMA, after falling below it in April 2022 – almost exactly a year ago when we lost that crucial moving average.
As I dug deeper into the data, I noticed that in December, the monthly RSI (Relative Strength Index) was essentially at its lowest point ever. From a technical perspective, this implies that since the rebound, we've started to see some hidden bullish divergence forming.
I've maintained a bullish outlook on crypto since December, and everything I'm seeing now only strengthens my case. While I still believe that we may experience a decent pullback in the coming month, I remain optimistic that the overall trend will continue to be bullish. The only caveat would be if Bitcoin loses the 21 EMA, as it would signify an extremely bearish scenario if we were to close a monthly candle below the 55 EMA. Currently, the 55 EMA stands at around $23,300 or so.
Closing below the 55EMA would be worst case scenario for Bitcoin bulls for the time being.

Bitcoin No Limits - World Takeover Don't Trust The MarketcapHello this is my first post for the future and some bitcoin projections I have been running during the bear market, everyone see it from my view and why this is a pretty historic event happening before our eyes. Biggest financial event in human history to be exact. . not just our lives.
2025
$855,775 Medium | Market cap ($17,971,275,000,000 based on 21m supply) $17.971 trillion
$2,038,869 Parabolic | Market cap ($42,816,249,000,000 based on 21m supply) $48.816 trillion
BASED on today's price of 1 Bitcoin worth $22,800 | Invested amount $2,052 = 0.09 BTC | Return on 2025 $183,498 that's 8,742%.
--------------------------
2030
$3,471,145 Medium | Market cap ($72,894,045,000,000 based on 21m supply) $72.894 trillion
$6,610,057 Parabolic | Market cap ($138,811,197,000,000 based on 21m supply) $138.811 trillion
BASED on today's price of 1 Bitcoin worth $22,800 | Invested amount $2,052 = 0.09 BTC | Return on 2030 $592,853 that's 28,791%.
--------------------------
You need to stop looking at Bitcoin based on market capitalization, this is not a technology stock, this is not a company they cannot be compared what so ever.
Its impossible to dilute Bitcoin, Its not impossible to dilute Apple shares.
Fiat money can be printed and devalued renominated, Its impossible to print Bitcoin and create inflation outside of the 21m limit.
Rick Falkvinge explains this perfectly, how do we calculate a 1 billion dollar market cap token?
Step 1 Issue 1 billion Tokens
Step 2 convince a few thousand people to buy each token for $1
Step 3 you now have what wall street uses to value companies economic value, and you probably just realized 100 Trillion in Bitcoin is not 100 trillion dollars, you can have a 1,000 trillion market cap with less than 50 Trillion of fiat value floating around in the asset.
You start to realize the total crypto market capitalization filled with scams was not 3.0 Trillion in real fiat value.
In 2021 at the peak only 176 Billion was the daily volume on Coinmarketcap, if you add in that market caps are not correct it would be less than a 10 billion per day of real fiat currency, its a lot correct but its not near what people thought.
Lets continue the journey and use Visual Capitalist to see what money looks like today.
-Notional value of derivatives is now estimated to be $600 trillion, notional value is another method to use over market cap.
-Market value of derivatives $12.4 trillion
-House hold wealth globally $463 trillion
-Commercial real estate $33 trillion
-Residential real estate $259 trillion
-Global debt $300 trillion
-Global money supply M1 $48.9 trillion M1 includes currency i.e. banknotes and coins, plus overnight deposits
-Global money supply M2 $82.6 trillion M2 is a measure of the U.S. money stock that includes M1 (currency and coins held by the non-bank public, checkable deposits, and travelers' checks) plus savings deposits (including money market deposit accounts), small time deposits under $100,000, and shares in retail money market mutual funds.
-Global Equities $95.9 trillion
-Central Bank Assets $28.0 trillion Fed, BoJ, Bank of China, and Eurozone only
Here we come to the end, where you should now understand even purchasing $1 dollar of Bitcoin can equal a range of multiples more than 10x of market cap pressure if you're measuring it in market cap.
What can we use besides market cap to find Bitcoins value? we can't it has not been created yet.
Further points, sovereign states who purchase Bitcoin and have no plan to make them available to the public market like El Salvador that's another multiples of leverage on top of the original purchase, and unlike derivatives this leverage can be held infinitely just how central banks store Gold bars infinitely.
Still wondering what this is implying after that long explanation?
For Bitcoin to get near a $100 trillion dollar market cap giving it a price of $4,800,000 per coin you could pull this off with less than $10 trillion of real fiat injecting into the Bitcoin economy if 21,000,000 coins are openly traded.
Some factors that will be unknown due to the nature of statistics
- how many coins are truly lost?
- how much fiat will central banks print?
- how many users will be on layer 2s like the lightning network?
-----------------------------------------------------------------------------------
This is why the Bitcoin exchange supply is acting abnormal and its starting to really decrease due to institutions, banks, funds all allocating behind the scenes regardless if Bitcoin goes to $5,000, $10,000 anything under $100,000 is cheap.
Fidelity investments one of the largest funds in the world notices this trend and they have made their decision.
What are pathways institutions are taking to capture this wealth?
- Cold storage.
- Long-Term Equity Anticipation Securities (LEAPS) call options that expire longer than 1 year.
- Avoid futures ETF's or any futures product that does not use underlying Bitcoin, these decay and have management fee's and will greatly reduce your profit. (I found this ETF that tracks Bitcoins price?) forget it don't touch it.
Bitcoin cycles will eventually became a thing of the past once adoption reached maximum velocity, lets enjoy the time we have with it now and respect it till its gone.
Better call Doc Brown when Bitcoin starts to move you're gonna see some serious s***
