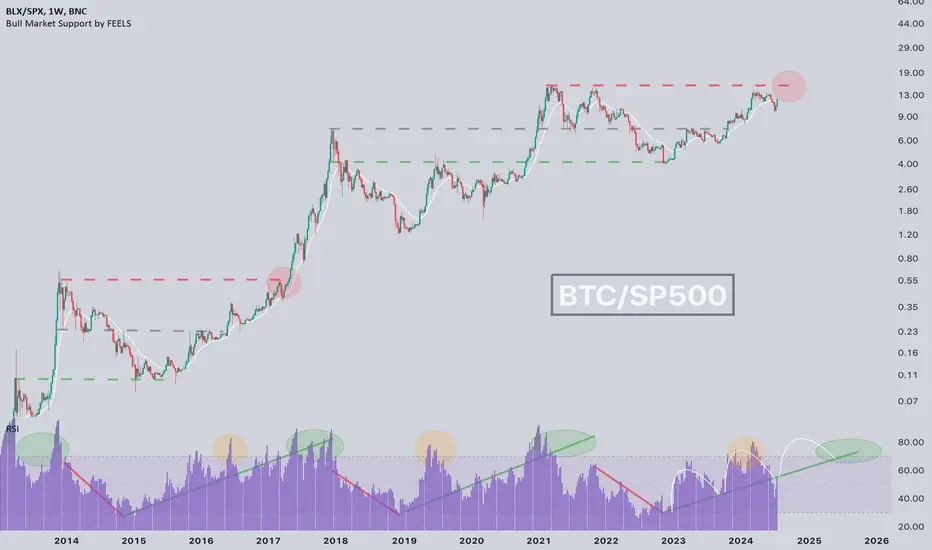
Bitcoin ATH hasn't happened yet !?CRYPTOCAP:BTC ATH hasn't happened yet ⁉️
If you don't count in fiat currency, we haven't seen the 2021 high exceeded yet (In relation to the stock market)
📝Everything is going according to plan, and by the end of this year, we will see a real ATH.
💡Also, it is clearly visible on the RSI that we will have a 3-wave cycle according to my 3-wave model, which I already talked about a long time ago.
BLX trade ideas
BTC TO THE FUTURENo one is ready.
Here's a question...
When btc went from $1 to $10, it never went below $10
When btc went from $10 to $100, it never went below $100
When btc went from $100 to $1,000, it never went below $1,000
When btc went from $1,000 to $10,000, it never went below $10,000
When btc goes from $10,000 to $100,000, what will happen?
When btc goes from $100,000 to $1,000,000, what will happen?
When btc goes from $1,000,000 to $10,000,000, what will happen?
GL and HF

$BTC - Direct escalation scenarioBYBIT:BTCUSD.P | INDEX:BTCUSD | CRYPTOCAP:BTC | BNC:BLX
Traders don't judge. We prepare for scenarios with a reasonable probability.

BTC (SMA50 and FED rate)#Bitcoin distance from 50SMA 👀
This SMA has often acted as support during a bull market.
📝The rate was also lowered today by 50 basis points, more than planned, a sign that the FED sees that the economy needs more help from the regulator.
💡Such a radical step is an indicator that very soon additional liquidity will appear on the market and, as we know from previous posts, it will, of course, settle in CRYPTOCAP:BTC and gold.


Will BTC follow the giant cup & handle pattern toward 300k!?Let the TA speak for itself... the ultimate level to hold and to buy is clear...

Minimum width on Bollinger bandsCRYPTOCAP:BTC Minimum width on Bollinger bands 🤔, What does it mean?
Of course, like last summer, seasonality has played a big role - volatility has fallen.
📝We have tested the lower part of the channel and are now testing the middle line. With a breakthrough, we have an open path to the upper part of ~72k.
💡Whether it will be a breakthrough the first time depends on the selling power of Mt. Gox investors. In my opinion, it is only a matter of time and in a few weeks, we will test the channel's top and go even higher↗️

BTC long time scenariosSo after this big dip it sound more easy to look from far on the Monthly Chart.
it can show use clearly that we are still in this bear Market for a long time.
Only a good catalyst would make BTC back in power mode.
First support would be a strong bounce on EMA at 4000ish.
Second Supoort 3200-3000. FOMO rebuy.
And the last one 1200-1500. Back to 2014 ATH.
Happy Tr4Ding!

MA OSCILLATOR RISK METRIC | BTC COLOURED CANDLES [DAILY]As promised, post showing the 'MA OSCILLATOR RISK METRIC' indicator on the daily time frame for you to explore.
This post shows BTC's behavior to historic over / under extension to price and historic levels of volatile in prior cycles on the Daily chart.
Feel free to interact with the chart on a computer via this post (phone apps only show the static image with trading view posts).

MA OSCILLATOR RISK METRIC | BTC COLOURED CANDLES [Weekly]Hi All. Since my prior post on this indicator, I have been asked to show this indicator with risk level colours against price. I initially built this functionality in originally (during the development of this indicator) a number of different ways but ended up simplifying to using pine scrip 'bar color' function.
This post shows BTC's behavior to historic over / under extension and volatile ranges in prior cycles on the Weekly chart. I will follow this post showing the daily chart.
Feel free to interact with the chart on a computer via this post (phone apps only show the static image with trading view posts).

Bitcoin double-top at 280K and 380KUsing ghost candles from the 2021 bull-run we have replicated a similar scenario. Targets based on cup and handle pattern, followed by fibs. Good luck, traders.

BTC/USDTHi everyone! Till this day I can't see why people are bearish on the best performing asset in the world! Graph explains itself

BITCOIN BULLMARKETThe bullmarket has begun boyz!
It is just the beginning. Control your emotions and focus on the targets.

Bitcoin Long Term Analysis & Price PredictionSince 2013, Bitcoin has followed a clear trend of setting tops the year after the most recent halving event. It has also been moving in a very clear trend channel in that time.
Bitcoin has yet to experience a real prolonged bear market. My prediction is predicated on us not having a recession until 2026. If we do, the market is probably going to top much sooner and lower than this chart.
If we have a recession in 2026, I expect the price of Bitcoin to break the current trend channel and head into a lower one as per the chart.
If on the other hand we have a true soft landing, I expect Bitcoin to stay in the current trend channel and head for another post halving year top in 2029.

BTC logaritmic regresion analysisThe red lines mark the hypothetical range of maximum for this cycle.
Until now, BTC has been behaving just as expected. The green box should mark the way up.
The gray zones represent the premium and the discount regions. Up and down respectively.
Follow your own plan. Greed and fear are never good advisors.
This is just an opinion, not an advice of any kind.
Market is the only master of its actions.


A setup not seen in 1420 days - BTC to 120kLast time Bitcoin crossed the last fib circle the 2021 bullrun started.
Let's see if history repeat itself, that would push btc to the 110k - 120k range .
It might be one hell of a ride !
This setup didn't occured in 1420 days.
GL everyones.

Once is by chance, Twice a coincidence, Three times is a patternTake a look at bitcoin peaks and troughs, peaks occuring routinely circa 1 year after the bitcoin halving, the trough following 1 year after the peak. Taking this into account as having happened thrice before, im going to assume the bitcoin peak comes in around the end of 2025 give or take a few months in either direction.

BTC and Zoinky Blue 'Zoinky Blue' looks good on the BTC BLX chart. White trendlines are taken from the monthly. Until we see that Pi Cycle top, we keep pushing. On the weekly we have just created a move up from trend levels zero lag. Now we just wait on dominance to decrease and an alt season. Then once pi cycle top is in we can flip bias. Zoinky showed us the way many moons ago.

The golden ratio multiplier for bitcoinThe Golden Ratio Multiplier explores Bitcoin's adoption curve and market cycles to understand how price may behave on medium to long term time frames.
To do this it uses multiples of the 350 day moving average (350DMA) of Bitcoin's price to identify areas of potential resistance to price movements.
Bitcoin has support of the 350 day MA and the 111 day MA. Maybe bitcoin shall go to the blue line and the price is now at 94422 dollar.
Don't forget to push the like button. Thank you. Greetings.

CUP AND HANDLE ON BLX AND TOP IN OCTOBER 2025Hello
Any of my analisis goes in same place as a target for this bullrun peaks.
Bullish bullish bullish !

#BTCUSD Monthly Cycle ComparisonsAugust 2024 has produced another successful (so far!) retest of the ~60 level on RSI on the monthly Bitcoin chart. The last two cycles have seen a cycle top 16 months and 14 months after the successful retest and gains of ~28x in 2017 and ~6x in 2021.
Just an observation really and past performance is no guarantee of future results but 14-16 months from now would take us to October - December 2025.
Fun times ahead hopefully!

BTC BOTTOM, TOP and main CORRECTION indicator.BTC BOTTOM, TOP and main CORRECTION indicator
1. GMMA indicator at the level of >-31 will show us the ideal bottom on BTC
2. The time of the main BTC correction occurs when BTC - correction in bull market is red and reaches the level of 0.44-0.48
3. The correction always ends with the regeneration of the indicator to zero.
4. We have the top on BTC when we reach the trendline on GMMA.
5. In previous cycles, the level of 78.6 fibo on GMMA confirmed TOP. In this cycle, we observe the trendline and 78.6 fibo which are at different levels.
