BLZ bullish impulse incomingThe short term target stands at 0.60$ and then we might see this heading towards 1$ pretty easy! 📈
BLZUSDT trade ideas

Bluzelle... Chance to skyrocket?Just sharing a technical view... Not financial advice. You're responsible for tour own risk.

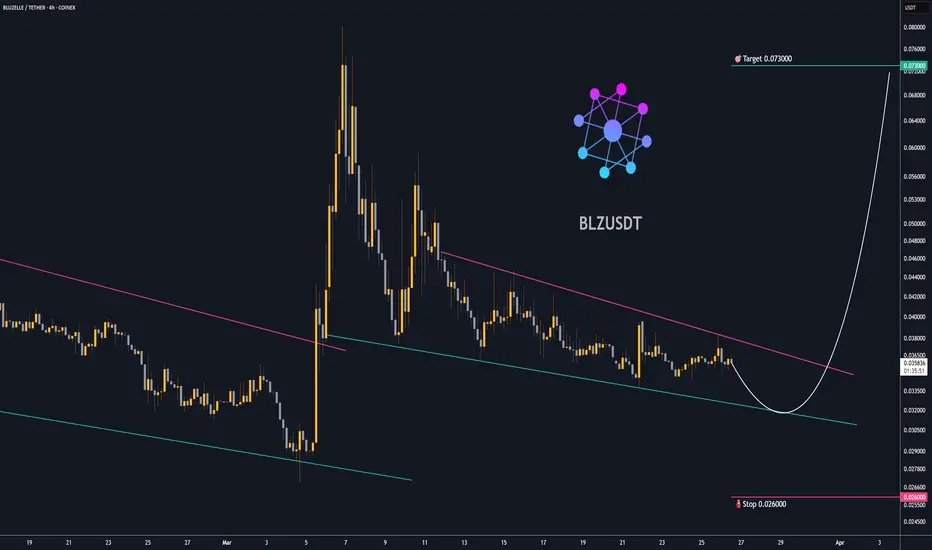
Trading opportunity for BLZUSDTBased on technical factors there is a Buy position in :
📊 BLZUSDT
🔵 Buy Now
🪫Stop loss 0.026000
🔋Target 0.073000
📏 R/R 3,8
💸RISK : 1%
We hope it is profitable for you ❤️
Please support our activity with your likes👍 and comments📝
Daily BLZ Coin Analysis - March 07#BLZ #Bluezelle
BLZ coin has risen more than 90% in the last 24 hours. BLZ coin has been in a downtrend for a long time. When we examine its technical chart, it is seen that it quickly crossed the resistance range of $ 0.05615 - $ 0.05276.
If BLZ coin falls to the support range of $ 0.05615 - $ 0.05276, it can be considered as a spot. However, since it is a very volatile coin, we think that a high amount of purchases should not be made. If BLZ coin starts its rise again from the support range of $ 0.05615 - $ 0.05276, its next target is the blue zone in the analysis.
NFA.

Trading opportunity for BLZUSDTBased on technical factors there is a Buy position in :
📊 BLZUSDT
🔵 Buy Now
🪫Stop loss 0.051000
🔋Target 0.081500
📏 R/R 2
💸RISK : 1%
We hope it is profitable for you ❤️
Please support our activity with your likes👍 and comments📝

Trading opportunity for BLZUSDTBased on technical factors there is a Buy position in :
📊 BLZUSDT
🔵 Buy by Breakout
🪫Stop loss 0.051000
🔋Target 0.099000
📏 R/R 3
💸RISK : 1%
We hope it is profitable for you ❤️
Please support our activity with your likes👍 and comments📝

BLZ COIN PRICE ANALYSIS AND NEXT POSSIBLE TRADE SETUPS !!GETTEX:BLZ Coin Updates and Possible Trade Ideas!!
• Before Delisting From Binance if its price Drop 0.05$-0.04$ area then potential Bounce back expected✅
• With SL I will Try To Build Trade under This range for 50%-100% gain using only 5% of my portfolio🚨
Warning : Right Now that's just my idea.. If i take trade then i will update🫡

BLZUSDT.1DThe daily chart of BLZ/USDT showcases the price movements within a clear framework of resistance and support levels. Notably, it has been mentioned that BLZ might soon be delisted from Binance, which could significantly impact its trading dynamics.
Price Action and Structure:
BLZ/USDT is trading at approximately $0.0682, showing modest activity within a largely consolidative pattern in recent months. The presence of a delisting rumor could be causing increased volatility or sell-offs as traders react to potential liquidity constraints.
Resistance and Support Levels:
Resistance Level (R1): The nearest resistance is at $0.2151. Overcoming this level might require significant bullish momentum, which could be challenging if the delisting rumors affect trader sentiment.
Support Level (S1): The primary support is observed at $0.0395. This level could be tested if the delisting leads to increased selling pressure.
Technical Indicators:
MACD: The Moving Average Convergence Divergence (MACD) is hovering around the baseline with minimal divergence, indicating a lack of strong directional momentum in the market currently.
RSI: The Relative Strength Index (RSI) stands at 52.84, suggesting a neutral market condition without overbought or oversold signals at this time.
Market Sentiment and Risks:
The potential delisting from a major exchange like Binance introduces substantial risk, as it could decrease the trading volume and accessibility of BLZ, possibly leading to price instability or decline. Investors and traders should be vigilant and consider the implications of exchange removal on BLZ's liquidity and price stability.
Conclusion:
Investors should closely monitor BLZ for any official announcements regarding its delisting status, which could fundamentally alter the market's perception and valuation of the token. The upcoming period could be critical, with potential increased volatility and strategic shifts by traders in response to the delisting news. It’s advisable to maintain flexible trading strategies and prepare for various scenarios as the situation develops.

#BLZ Trade setup. $BLZ/USDT 1H Chart: Breakout incoming? Price is consolidating below resistance .
supported by an ascending trendline.
A breakout entry $0.1897 could take up to $0.2450.
SL at $0.1791 for risk management.
DYOR , NFA

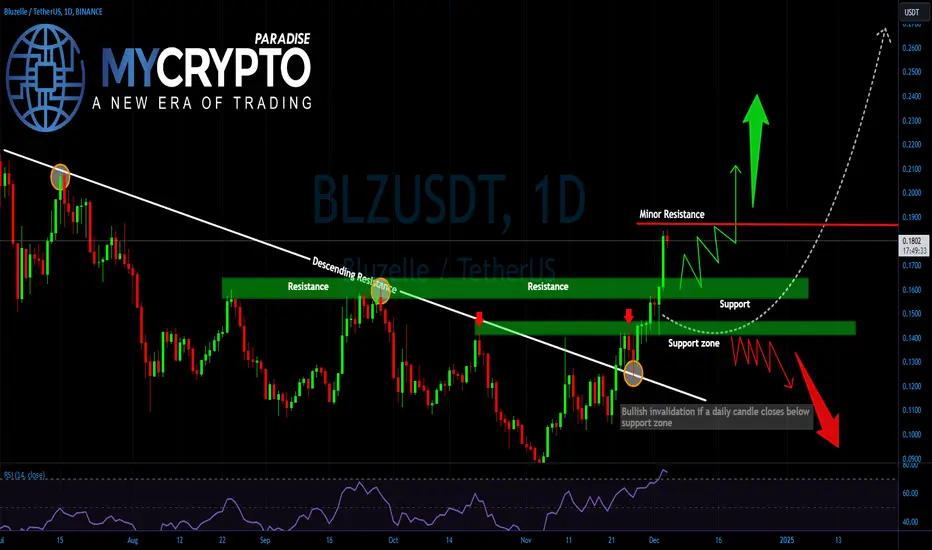
Is BLZ About to Explode? Critical Levels You Can't Miss!Yello, Paradisers! Are you ready to spot the next big move on BLZ/USDT? The price action is at a make or break moment, and understanding these key levels could define your next trading decision. Let’s dive into it.
💎 BLZ/USDT surged past a descending resistance line that had suppressed price action for months, signaling a potential bullish breakout. For now, the price is approaching the current minor resistance around $0.1866, which is capping upward movement. If BLZ manages to break above this zone with conviction, we could see a strong rally targeting the $0.25–$0.27 region, which represents the next significant resistance level.
💎 If the price fails to break above the minor resistance, it could retrace to the $0.1563–$0.1638 support zone, which is now a crucial area to watch. This zone, previously a resistance level, is acting as a foundation for further upside momentum. As long as this level holds, the bulls remain in control.
💎However, if the price falls below the $0.1563–$0.1638 support zone, a deeper correction toward the $0.1412–$0.1461 lower support zone could unfold. Buyers are likely to step in aggressively at these lower levels. A decisive daily close below the lower support would invalidate the bullish structure, potentially leading to a sharp decline and trapping late buyers.
Trade smart, Paradisers, and let the market come to you. It’s all about consistency and strategy. Stay focused and keep mastering the art of trading.
MyCryptoParadise
iFeel the success🌴
BLZ - the box1500 days of accumulation, you can gain a position, paired with btc it looks like a reversal. The first target is around 1 dollar. Potential - $3

Trading opportunity for BLZUSDTBased on technical factors there is a Buy position in :
📊 BLZUSDT
🔵 Buy Now
🪫Stop loss 0.1325
🔋Target 1 0.1600
🔋Target 2 0.1800
🔋Target 3 0.2100
💸RISK : 1%
We hope it is profitable for you ❤️
Please support our activity with your likes👍 and comments📝

Bluzelle Spot Buy Blz has the potential to do 100x. It’s price is racing towards resistance area quickly if this resistance area is broken it will Pump to do 100x easily.
Wait for the daily candle to closes above 0.1600 for the spot buy with target 0.3300.

BLZ analysis (8H)Note that this is a buy/long setup, not a sell/short setup.
BLZ appears to be now inside a diamond diametric. BLZ now appears to be in wave E of this diametric.
We will look for buy/long positions in the green range.
The targets are clear on the chart
Closing a daily candle below the invalidation level will violate this analysis
For risk management, please don't forget stop loss and capital management
Comment if you have any questions
Thank You


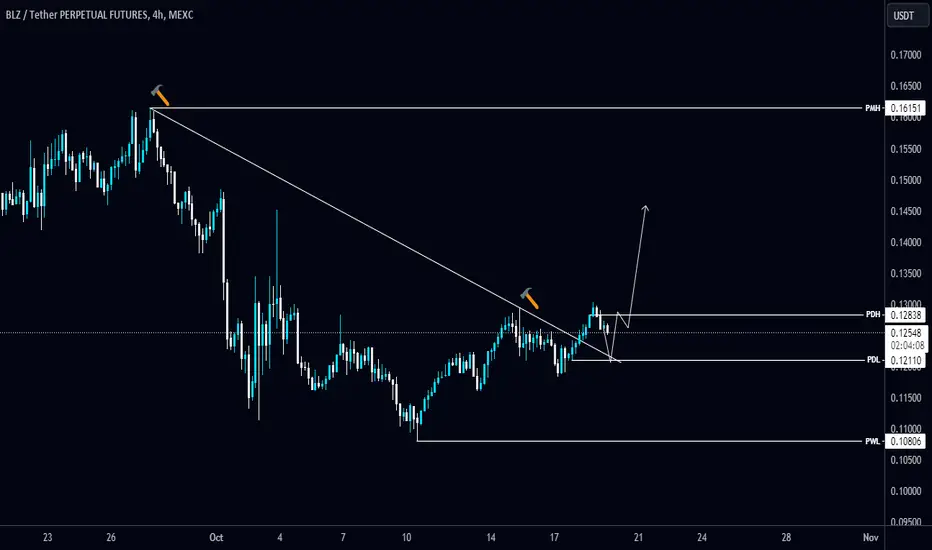
#BLZ/USDT breaks the Diagonal Trendline in 4-Hour TF!#BLZ/USDT breaks the Diagonal Trendline in 4-Hour TF!
Waiting for a successful retest to long $BLZ. The local resistance level is PMH $0.1615 and the support level is PDL $0.1211.
BLZUSDT.P LONGBLZUSDT.P LONG
BLZ just had a massive move to the upside and is parabolic state.
Entry - 0.14485 - 0.14688
SL - 1-5% or 0.14200
TP - 0.17754 or when happy!
Use only low lev and 1% risk
TYOR
DYOR
NOT A FINANCIAL ADVIICE
Happy trading everyone!

Bluzelle (BLZ): Possible Bullish Momentum / Catching Sell SoonBluzelle seems to have found its foundation and is recovering slowly from here by testing again the 100EMA (where lately we had a small rejection).
Now buyers are not yet exhausted so we think there is a chance to see another touc to 200EMA and a possible fakeout above it as well.
Swallow Team

Where to buy BLZ?It seems that we have a corrective diametric on the chart, from which the G wave is left.
The green range is a powerful range. If the price reaches this range, we will enter buy/long positions.
When you enter the position and make a profit of 20% or more, proceed to save profit.
Closing a daily candle below the invalidation level will violate the analysis.
For risk management, please don't forget stop loss and capital management
Comment if you have any questions
Thank You

BLZ#BLZ
Now:17h34 22.8.2024 GMT+7, Hanoi, Vietnam
Chart:H4
Contact me by clicking on the link pinned on my profile
Note: I never texted you first.
#giapduclong #crypto #forex #index #stock #trader #signal

BLZ looks bullishFrom where we placed the green arrow on the chart, it looks like an ABC pattern or a more complex pattern has formed
.
Wave A is over and it seems we are now in Wave B.
Wave B looks like a triangle.
BLZ is expected to rise up to the red box (in the red box wave d of B can be completed) and then reject to the green box (for wave e of B).
For risk management, please don't forget stop loss and capital management
Comment if you have any questions
Thank You

BLZ technical analysisBLZ is in a bearish trend and moving in a falling wedge for approximately 125 days. The support zone (Yellow) at $0.1080 - $0.1241 is holding the price. If this zone failed to hold the price we could see more decline in the price. After the breakout from the trend line, we could see some bullish moves. If the momentum continues we could see the price to the next levels.
Traders should be vigilant, considering positions based on the support's reaction and entering a buy if it holds. Always consider risk management strategies, especially with the current market volatility, and set stop-loss orders to protect against unforeseen price movements.

Is a Major Move Imminent? #BLZUSDT on the Edge of a Breakout!Yello, Paradisers! Are you ready for a breakout that could shake up the market? Here's what you need to know about #BLZUSDT right now.
💎#BLZUSDT is flirting with a descending channel, and we're on the verge of a potential breakout that could ignite a strong upward move. At the moment, #BLUZELLE is testing the channel's resistance while trading within a consolidation zone.
💎If it can hold steady at the crucial support level of $0.1106, we might see a substantial push toward our target resistance levels.
💎But, as always, the market is volatile. If #BLZUSDT loses its grip and drops below $0.1106, it could signal the end of this bullish momentum, leading to a significant price decline.
Stay sharp, and play it smart, Paradisers. We're in a critical zone right now.
MyCryptoParadise
iFeel the success🌴
