Bluzelle Rallies on Bullish MomentumBluzelle (BLZUSDT) has been on a tear for the past two days, surging in price after finding support at the crucial $0.30 level. After successfully closing above this key area, BLZUSDT has rallied to its current price of $0.420, and now eyeing a potential climb to $0.453 or pullback from here.
The recent bullish momentum suggests a shift in sentiment for Bluzelle, a blockchain project focused on decentralized data storage solutions. The coin had been trading in a slump prior to this breakout, but the bounce off the $0.30 support indicates a renewed interest from buyers.
BLZUSDT trade ideas

I Cannot SHORT This !!!HI.
Seems we have a channel on weekly timeframe
Want to see a break upwards of channel🚀
👀To motivate me , Please Like ❤️ & Share 🌐 this post with your friends ! Thanks for your support ♥️
⚠️Things can change...
The markets are always changing and even with all these signals, the market changes tend to be strong and fast!!

BLZUSDT(Bluzelle) Daily tf Range Updated till 18-04-24BLZUSDT(Bluzelle) Daily timeframe range. even when market is week, its holding pretty good here for now. stuck between 0.4410 and 0.2905 for a while. if it can stay above 0.2905 it will break out of this range level.

SHORT #BLZSHORT #BLZUSDT from $0.347
15m TF. The instrument continues to be in a downward movement structure, the price does not update the highs, while each time it works with the nearest liquidity, from which we get an increase in seller activity, trading volumes are generally increased, an excellent cascade of lows has been formed from below, which continues to retain unrealized liquidity, the removal of which I will consider, I expect the potential movement to the buyer's area of interest at around $ 0.32

Long Trade Position BLZUSDTTest your analytical skills in the tradingview simulator with virtual money to become a professional. In spot trading, I will specify the entry points, loss limit and profit limit for you! The conditions for entering the trade and our strategy are as follows, when you notice that the market trend is increasing and at least two green candles close above the entry point in fifteen minutes, you can enter the trade from the beginning of the third green candle. Be patient and don't rush to enter! After the price reaches the first target, move your stop loss below the first profit limit so that if the price reverses, your trade will be closed with profit. Repeat the above strategy to continue the price targets shown on the chart. If the price reaches or falls below our loss limit before the above condition, entering this transaction is invalid because it must be re-analyzed and the new entry, loss and profit limits must be determined. Note that the market trend is formed with clever tricks by the market maker, so even the most powerful analyzes may be invalidated. The only thing we can do is to surf the waves and stick to our strategy so that while taking care of our capital, Let's make a profit. These exercises will make you experience profit and loss with virtual money in the real market and improve your analysis and personal strategy. Know your fear and greed and gradually control them so that your business becomes profitable and you suffer less loss.

#BLZ/USDT breaks the Diagonal Trendline with a bullish momentum #BLZ/USDT breaks the Diagonal Trendline with a bullish momentum in 4-Hour TF!
I am placing my bids near $0.391 for a long position. I am expecting more bullish momentum. Let's see if we got filled or not.
The major support level is PWL $.03675, and the resistance is $0.4655.

BLZ/USDT LOOKS PROMOSIMG BLZ/USDT pair is showing promising signs for the mid-term. The structure is transitioning to a more bullish pattern, leading me to anticipate an imminent breakout. A bullish move of 60-120% is expected in the mid-term.
Please note, this is not financial advice. It is recommended that you conduct your own research (DYOR) before making any investment decisions."

BLZ possible Squeeze Leverage Longed Blzusdt here from 0.3280.
Flat and tight stops at 0.3230.
Highly risky because of tight stops but if holds and continued this can really blow higher.
Will target 0.4700 and 0.6.
Note: Not a Financial Advice.

BLZUSDTmy entry on this trade idea is taken from a point of interest BELOW an inducement.. I extended my stoploss area to cover for the whole swing as price can target the liquidity there before going as i anticipate.. just a trade idea, not financial advise

BLZ 2.5?In terms of price movement and the fact that it has been accumulating for 1300 days, it is similar to TRB currency. I expect good growth if the ceiling of 0.50 is broken.
DYOR

BLZ/USDT Facing on the key resistance area. Could Breakout ??💎 BLZ has recently exhibited significant market dynamics, encountering a key resistance area.
💎 A successful breakout from this resistance could ignite a bullish momentum, probability leading to significant upward movement and reaching our target area.
💎 However, if BLZ fails to break above this resistance level, the price may face rejection and subsequently move downward, potentially retracing back to test the demand area to establish new momentum.
💎 The demand area is a critical zone, and BLZ needs to bounce from this level and reclaim the price above it. Failure to do so could result in BLZ losing this support level and continuing its downward movement, potentially experiencing further decline.

BLZ has formed a Bullish SetupBLZ has formed a Bullish Setup. After the bounce from the support zone I expect that it continues to go up.
🔵Entry Zone 0.3913 - 0.007630
🔴SL 0.3869
🟢TP1 0.4094
🟢TP2 0.4297
🟢TP3 0.4769
Risk Warning
Trading Forex, CFDs, Crypto, Futures, and Stocks involve a risk of loss. Please consider carefully if such trading is appropriate for you. Past performance is not indicative of future results.
If you liked our ideas, please support us with your likes 👍 and comments.

#BLZ/USDT breaks the Diagonal Trendline in 4-Hour TF!#BLZ/USDT breaks the Diagonal Trendline in 4-Hour TF!
FWB:BLZ is looking good to long. The local resistance level is PWH $0.3132, and strong support level is PWL $0.2322.

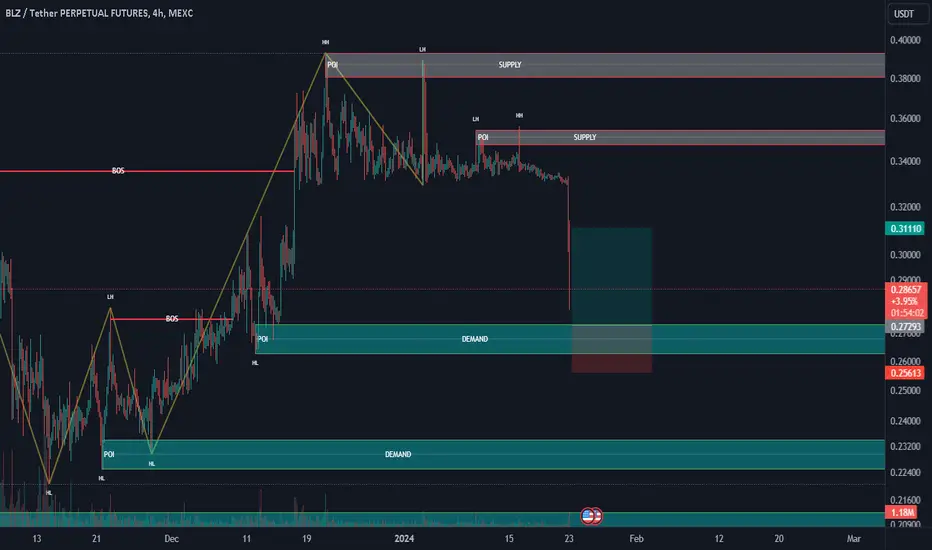
BLZ ANALYSIS 4HConsidering the bearish CH and bearish iBOS on the chart, it seems that BLZ has a trend change.
The pump that we are seeing now seems to retest the supply range and collect sell orders for more drops.
I have specified the movement we expect from blz on the chart.
The targets are clear on the chart and I also specified the invalidation level. Closing a 4-hour candle above this level will violate the analysis.
For risk management, please don't forget stop loss and capital management
When we reach the first target, save some profit and then change the stop to entry
Comment if you have any questions
Thank You


BLZ SELL Trade "Welcome to the crypto insights hub! Dive into daily technical analysis covering Bitcoin, altcoins, and more. Join the conversation and enhance your crypto knowledge!
📈
Disclaimer: Crypto markets are unpredictable. Use technical analysis wisely, alongside other factors. This is not financial advice."

BLZ LONG hello Traders, here is the full analysis for this pair, let me know in the comment section below if you have any questions, the entry will be taken only if all rules of the strategies will be satisfied. I suggest you keep this pair on your watchlist and see if the rules of your strategy are satisfied. Please also refer to the Important Risk Notice linked below.
Why is the price still so high?I've not found any evidence to suggest why the price should be holding when everything else on the market is pulling back, so I can only assume manipulation which when it plays out can lead to an epic dump a la BNX, TRB, POWR etc, let's see...
Hoping there's not too much manipulation of the price to wipe out any early shorts before it happens.
Until then...

BLZ SHORT .The observed negative correlation between BLZ (Bluzelle) and BTC (Bitcoin) implies an inverse relationship in their price movements. When BTC experiences a decline, BLZ tends to exhibit a corresponding decrease. This negative correlation suggests that the two assets move in opposite directions, with BLZ showing a tendency to decrease when BTC faces downward pressure. As a result, investors might consider adopting a short position on BLZ during periods of BTC decline, anticipating potential profit opportunities from the negative correlation between the two assets. However, it's crucial for investors to conduct thorough research, consider other market factors, and manage risks appropriately when making trading decisions based on correlations.


#BLZ Funny Chart#BLZ WTF Is This Piece of ?
Very strong compression and no volatility for 25 days. Absolutely no idea where this is going. But it will be a quick 10% move in the case of a breakout.

A Tactical Approach to #BLZ/USDT Trading with Strong Support!#BLZ/USDT pair:
Technical Analysis:
Strong Support Level: The current scenario indicates that BJD is above a strong support level, suggesting a potential rebound in the price.
Entry Point:
Buy at CMP: Consider buying at the Current Market Price (CMP), taking advantage of the current position above the strong support level.
Additional Entry: Add more positions if the price drops to 0.3307, using this level as an additional buying opportunity.
Target Prices:
Set specific target prices at $0.37540, $0.4, $0.43, and $0.49. These levels represent potential profit-taking points as the price moves upward.
Stop Loss (SL):
To manage risk, set a Stop Loss (SL) at 0.3205. This level is chosen to limit potential losses in case the market doesn't move as expected.
Risk-Reward Ratio (R:R):
The Risk-Reward Ratio is mentioned as 1:6, indicating a favorable ratio. This means that for every unit of risk (1), there is the potential for six units of reward.
Cautionary Note:
Emphasizes the importance of exercising caution with leverage and aligning it with individual risk tolerance. The suggestion is to use leverage conservatively to avoid significant losses.
Reminds traders to conduct their own research (DYOR) before making any trading decisions, and clarifies that the provided information is not financial advice.
In summary, the recommendation suggests a bullish stance on #BLZ/USDT based on the strong support level. It provides specific entry points, target prices, and a risk management strategy, while also advising caution with leverage and emphasizing the importance of conducting personal research. As always, the information provided is not financial advice.

Long configurationLong term accumulation
Strong limit level 0.33
In case of accumulation of bitcoin, looks very perspective to has 100%+ of profit
Profitable trades!
