A1DI34 trade ideas

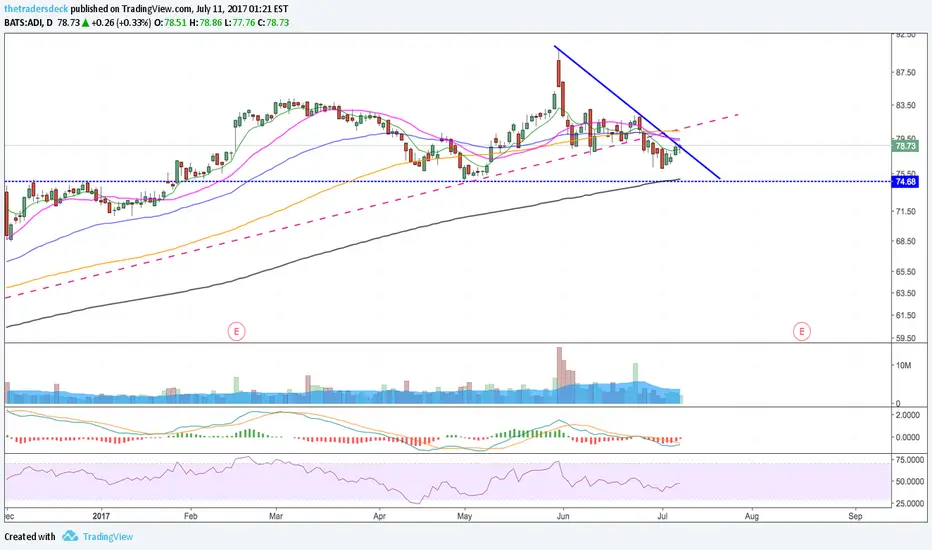
ADI - Descending TriangleThe $103.90 price range has been a good support line for the stock since February. The price broke down in May before regaining the line with the June rally.
The descending triangle pattern has been in place since mid-July. Another breakdown of the support line would trigger the pattern with a price target of around $82.


ADI, Analog Devices Inc. - Trade of the dayExcellent breakup of the resistance of this continuation Cup & Handle.

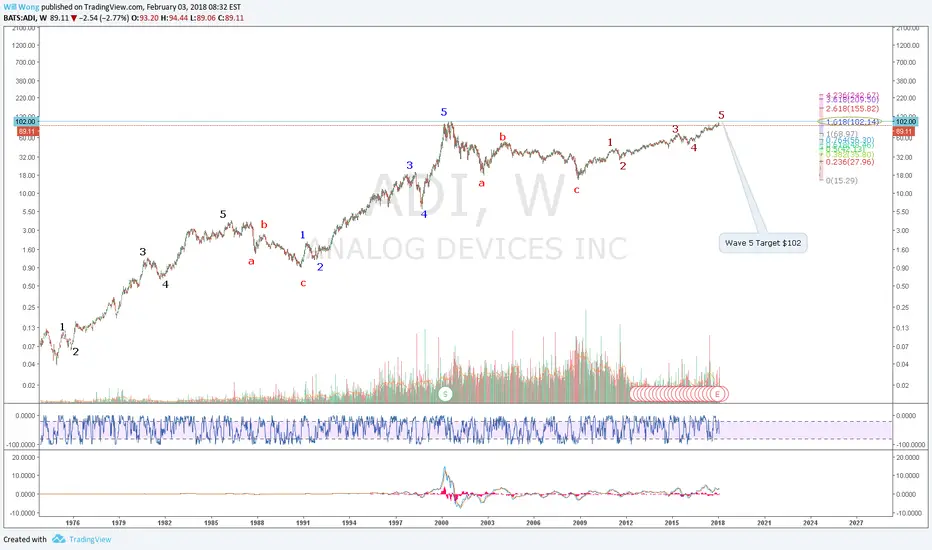
Analog Devices #ADITrend is up on all time frames.
Looking to go long at weekly Demand zones confluence with monthly trend lines and demand zones.


Just entered earnings play spreadBot Mar1 105 calls @ 2.30 and 102 puts @ 1.40. $370 per spread. The puts are our insurance, but expecting another 5% up swing


Analog Devices Reinstates Share Repurchase ProgramADI: Analog Devices, Inc.
2018-08-21 17:00:00
Analog Devices Reinstates Share Repurchase Program; Increases Authorization by $2 Billion

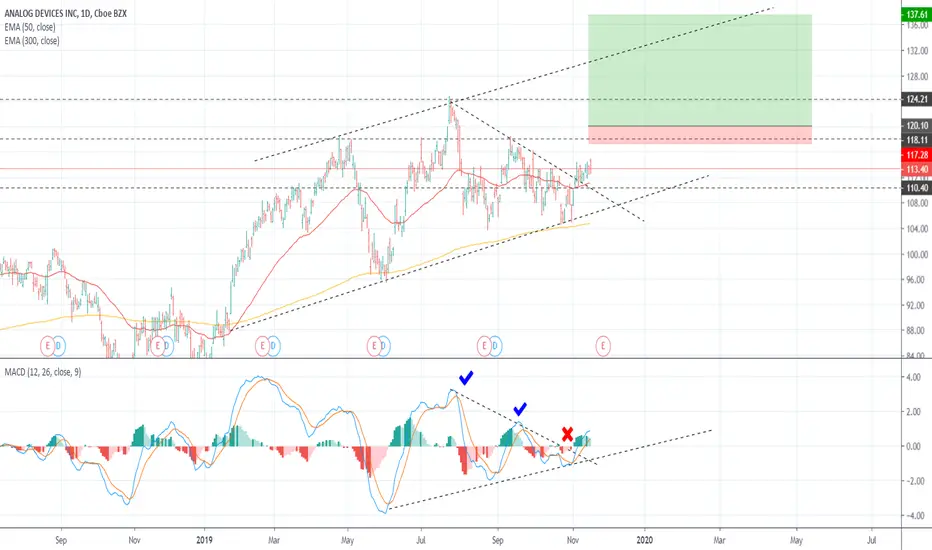
Bull DaysNew Resistance to be created. In meantime, riding upward wave before eventual downward swing as it has already crossed overbought territory.

ADI to $92 in long term uptrend Looks like ADI has been consolidating for a few months within this long term uptrend. I'd expect a bounce around here with a price target of mid $90's in the coming months.


ADI - Stochastic Divergence on Trend LineBuy: 86.04
Target: 87.56 - 90.02 (1.77% - 4.63%)
jbzstocks.com
@jbzstocks

ADI breakout to the downside!!higher time frame is showing defined downtrend and exhibiting trend strength- using moving averages as dynamic resistance/
support
-intermediate timeframe shows trend alignment to the downside and price pull back to short term moving average
-looking for it trade to pivot low of 78.58 and breakout to the downside on intermediate timeframe
-on the shorter time frame- it is also showing trend alignment and favors a higher probability favoring the trend to the downside
-price is also pulling back to the .236 retracement level of 78.98..would look to initiate position in that area to the ride back down and setting a tight stop over 79.0x area
-as price resumes downtrend on the intermediate timeframe- it should also translate to the lower time frame and breakdown past the pivot low of 78.58 and along with increased selling pressure towards the path of least resistance to 74.7x area (.618 extension level)

