Trading Journal Initial buy was good, sell was premature ( i think general market weakness and not wanting profits to turn into breakeven, sold early), should have waited).
In the end it worked out because stock gapped lower ( luck played).
Retried buy again but weakness got me to sell the next day.
A1LN34 trade ideas

ALNY, LTH & ZETA - The momentum may drive prices to new heights!Alnylam Pharmaceuticals
The stock price has encountered several rejections around the 212 level, leading to subsequent corrections.
After establishing a Double Bottom pattern, the price attempted to reverse the downward trend but was unable to do so, facing rejection at the 200 level.
Consequently, the stock underwent another correction.
Following this, the price entered a consolidation phase, forming a Box pattern for a while.
In a surprising turn, the price gapped up significantly and broke through its former strong resistance area, remaining above it.
Following a brief pullback, the price resumed its upward trajectory, supported by solid trading volume.
Life Time Group Holdings
Following a rejection around the 22.5 level in November 2021, the stock experienced a significant decline, dropping to just 8.75.
Subsequently, the price began to rise again, eventually returning to its previous strong resistance level after a lengthy climb. However, it struggled to break through that barrier and faced another substantial drop.
During this downturn, the stock hit a low around 11.3 and then navigated through numerous fluctuations, leading to the formation of a Symmetrical Triangle pattern on the chart.
After successfully breaking out of this pattern to the upside, the price surged and managed to overcome the resistance level.
If the stock can hold onto this level, we might see even more upward momentum in the days ahead.
Zeta Global Holdings
The stock price had been consolidating within a Box Pattern before breaking free.
Since that breakout, the stock has experienced a steady uptrend, marked by higher highs and higher lows.
Amid this upward movement, a Cup & Handle pattern formed, signaling that the trend is likely to persist.
Following the breakout, the price is now climbing higher, supported by a significant increase in trading volume.

ALNY correctionThis is at the top of it's channel after a gap up, needs some room to breath.
This is not trade advice
ALNY Indecision Candle w/ Tons of VolumeFound this with a volume scan on FINVIZ.
Massive indecision/high wave candle with tons of volume.
Wait for a close either above the high or below the low, and play accordingly. For example, if it closes above the high, I'd be in bullish. If it closes below the low, I'd be bearish.
Enjoy!

ALNY. Alnylam PharmaceuticalsALNY is through a corrective pullback Right now it's in a position where it can go Bullish.
But it is what I call a weak buy demand because it's 50% of the peak where it started the reversal pullback. To buy from this position, I need to see a clear reversal pattern otherwise I´ll wait for it to continue the pullback and buy from the strong demand.

Alnylam Pharmaceuticals - ALNY (Long)Alnylam Pharmaceuticals, Inc.
Long
Enter: 197.20
Take Profit: 214.49 (8.77%)
Stop Loss: 186.70
R:R Ratio: 1.65
Chart is bouncing of a parallel channel with a bullish candle

#ALNY trade plan up to 18-Aug-23Based on our team's research of the options market, we expect buy activity at the support level or sell activity at the resistance. Although the amount of money involved is not large (less thatn 1 million dollars), the size of the option position is about 50% of the typical daily volume, indicating a substantial interest in breakpoints.
We primarily consider levels to be activity zones, but not to be a super-fine level for establishing a limit order. Use them in combination with our own strategy, not in alone.
We do the best research as we can to find new opportunities in the massive amount of information every day to help you make data-driven trading decision.
Please feel free to leave any comments you have and like this idea if you agree with us. Any feedback or comments will be read. We appreciate it all!

Breakout descending trendlineWe see a successful breakout there and waiting for a retest of the descending trendline from December 22
And at this point after a successful retest price might hunt previous ATH
Entry point, SL, TP on chart GL

ALNY - 3rd Wave Could Be ImpulsiveALNY has been printing 2 corrective pattern separated waves and following an upper wicked shakeout reversal now appears to be entering a third wave that could potentially see a change up to become impulsive.
As we've seen many times now the fast wick up followed by impulsive downside is the BIG clue the trend is changing and also that it may become impulsive.
This will probably break through the 50MA soon and potentially have a lot of downside as I have shown on a previous thread this can potentially be the top of a MAJOR bear market moving through Distribution.
Bearish RSI divergence is also signalling further downside.
Not advice.

$ALNY with a Bullish outlook following its earnings #Stocks The PEAD projected a Bullish outlook for $ALNY after a Negative over reaction following its earnings release placing the stock in drift C with an expected accuracy of 75%.

ALNY - Topping Shakeout Manoeuvre This one is for @tintin85, as I was just browsing through his list from supposed guru Mark Minervini.
ALNY has pumped hard on bad earnings and this I think is potentially a shakeout move before a fall.
ALNY has been in a long term ascending wedge for many years and this recent pump has gone from the lower to upper trendline in a day.
Also RSI divergence throughout the wedge.
I think this stock will have a major collapse and I am short.
Not advice.


Head and ShouldersPrice has broken the neckline.
Possible stop above neckline if short.
Possible targets in orange below price.
Price recovered from a prior large Head & Shoulders structure.
No recommendation

$ALNY with a Bullish outlook following its earnings #Stocks The PEAD projected a Bullish outlook for $ALNY after a Negative Under reaction following its earnings release placing the stock in drift D with an expected accuracy of 60%.

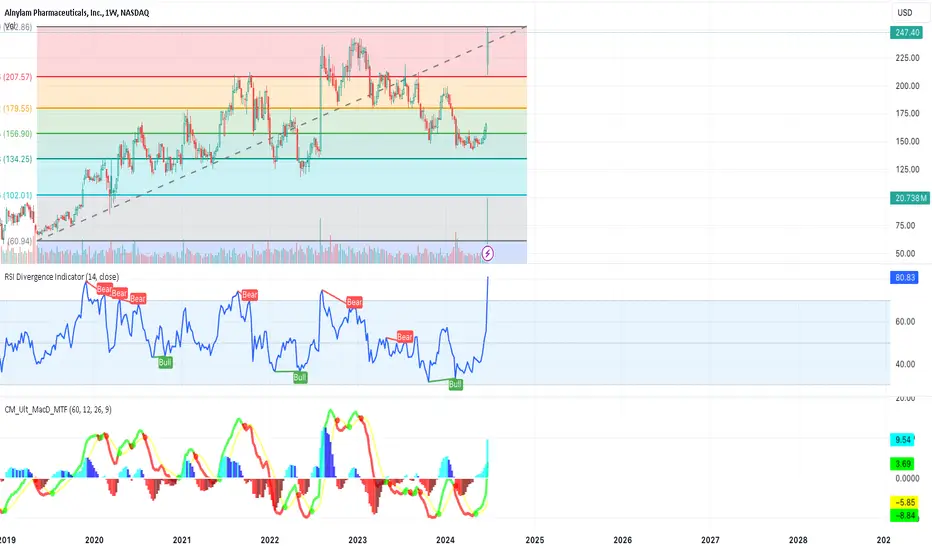
ALNYThe biotech index looks sad so far. However, considering a specific stock, we have that we have bullish divergences, although not sure, the level, as well as the ema200 for the week.
From the fundamental one, you can attract interest in RNAi technology. Recently, DRNA was purchased with their platform, this company has its own, respectively, and the same areas of research.

ALNY on track to $263ALNY put in a new ATH as expected. A big bearish divergence played out after hitting the 1.618 fib extension plunging it all the way down to ~$155 and reaching oversold on the RSI. It resumed the uptrend as it followed a new trend line, which it broke as the S&P plunged on 3rd December. However, it seems to be recovering quickly and if it can break the important resistance around 178 and turn it into support it looks primed to retest ATH at ~$212 and continue towards the 2.618 fib at ~$263.

Alnylam Reports Positive Topline Results from ILLUMINATE-C PhaseALNY: Alnylam Pharmaceuticals, Inc.
2021-07-29 07:00:00
Alnylam Reports Positive Topline Results from ILLUMINATE-C Phase 3 Study of Lumasiran in Patients with Advanced Primary Hyperoxaluria Type 1


ALNY ready for a new ATH this year?ALNY is in a multi-year uptrend and it seems possible that a new ATH will be reached this year.
Bullish signs:
1) Bounce on the multi-year-trend-line (in black).
2) Trading above 20 + 50 EMA on daily, weekly and monthly.
3) Correction since january has reset the RSI.
4) Month of may forms a dragonfly doji.
What we'd like to see:
a) A higher high and a higher low on the daily.
b) A daily close above 145.
c) Increasing volume.
If june is green, volume increases and we break through 145 i think a new ATH is imminent.


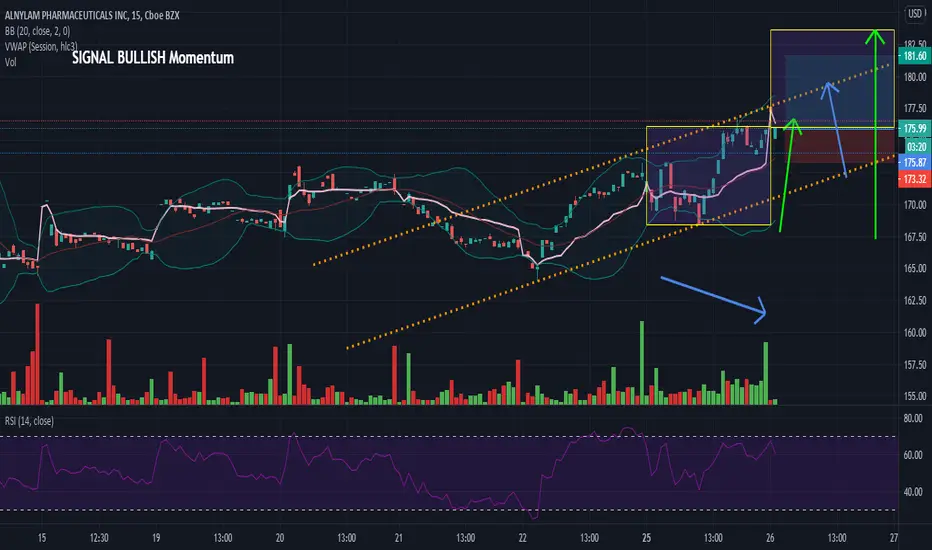
ANYLAM PHARMACEUTICALS StrategyHey guys, ANYLAM PHARMACEUTICALS is at a very important moment in its history, we can witness a new historical high. It is in a bullish configuration with a hammer candle and a strong buy volume issued. In the TIMEFRAME M1 we see a marubozu with a negotiated purchase volume return, it came to test the highest of the bollinger and subsequently yield it. And reach the top of the consolidation zone for a re-test. Great possibility of breaking out the price then then the zone to join another and make a new high point.
It goes towards the top of the bullish channel to test it with a symbolic number of 181.00. Before testing the consolidation zone and advanced breakout.
Please LIKE & FOLLOW, thank you!