ATO Purchase: Natural GasAtmos Energy is one of the largest fully regulated natural gas utilities in the U.S., serving over 3 million customers across 8 states. It operates in a stable, recession-resistant sector with predictable cash flows and strong regulatory relationships.
$24B Infrastructure Investment Plan through 2029 to modernize pipelines and expand service
20 New Industrial Customers added recently, boosting demand
Strong Regulatory Framework ensures cost recovery and stable margins
EPS Growth Forecast: ~7.6% annually through 2029
Atmos Energy offers a low-risk, income-generating investment with:
Strong fundamentals
Reliable dividend growth
Long-term infrastructure tailwinds
Defensive positioning in volatile markets
GreenBlue Rank: 291/2500
GreenRed Rank: 3/3147
A1TM34 trade ideas

ATO , Trades This became a short and looks like its breaking , originally came up as a long consideration and was still on my main list , may take more shorts .... not interested in longs unless maybe its intraday , prob not .


ATO: some upside?A price action above 113.00 supports a bullish trend direction.
Increase long exposure for a break above 116.00.
The target price is set at 119.00 (its 78.6% Fibonacci retracement level).
The stop-loss price is set at 111.00 (just above its 38.2% retracement).
An ascending wedge pattern seems to be developing.
Remains a risky trade.

XLU Pair tradeI am monitoring a pair trade in XLU.
Long ATO
Short WEC
The overall XLU is looking weak but is heavily skewed. There's pockets of strength potentially setting up in some individual names.

$ATO with a bullish outlook following its earnings #StocksThe PEAD projected a bullish outlook for $ATO after a positive over reaction following its earnings release placing the stock in drift B with an expected accuracy of 80%.

$ATO with a Bullish outlook following its earnings #Stocks The PEAD projected a Bullish outlook for $ATO after a Positive Under reaction following its earnings release placing the stock in drift A with an expected accuracy of 66.67%.

ATO: some further upside potential?A price action above 115.50 supports a bullish trend direction.
Further trend support above 117.00.
Consolidation range from 117.00 to 118.50.
Crossing above 118.50 might set the target of 121.50, which is the upper range of the Bollinger Bands.
Crossing below 117.00 will be the first sign of pending weakness.
Remains above its 200-day simple moving average.

$ATO with a Neutral outlook following its earnings #Stocks The PEAD projected a Neutral outlook for $ATO after a Negative Under reaction following its earnings release placing the stock in drift D with an expected accuracy of 66.67%.

16/3/2022 NYSE (ATO)Buy (Entry Price) above the black line and exit (Stop Loss) below the red line. Can take profit at the suggested Target Price.
Entry Price: $114.25
Target Price: $116.05
Stop Loss: $111.24

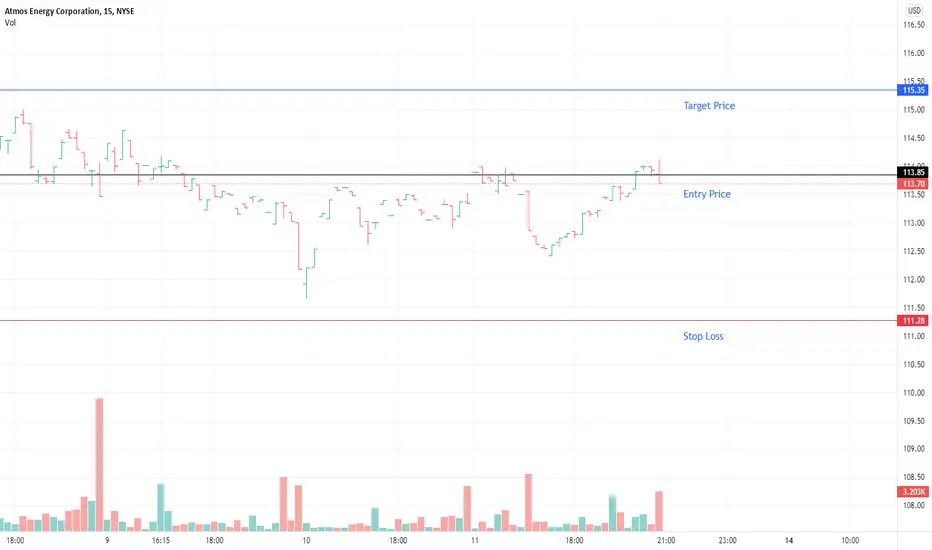
14/3/2022 NYSE (ATO)Buy (Entry Price) above the black line and exit (Stop Loss) below the red line. Can take profit at the suggested Target Price.
Entry Price: $113.85
Target Price: $115.35
Stop Loss: $111.28
Atomos Energy Will Bottom SoonBased on historical movement, the trough could occur anywhere in the larger red box. The final targets are in the green boxes. The pending top should occur within the larger green box as has been the historical case. Half of all movement has ended in the smaller green box. In this instance, the signal indicated BUY on September 15, 2021 with a closing price of 89.56.
If this instance is successful, that means the stock should rise to at least 91.07 which is the bottom of the larger green box. Three-quarters of all successful signals have the stock rise 4.175% from the signal closing price. This percentage is the bottom of the smaller green box. Half of all successful signals have the stock rise 7.193% which is the end point of the black dotted arrow. One-quarter of all successful signals have the stock rise 18.853% from the signal closing price which is the top of the smaller green box. The maximum rise on record would see a move to the top of the larger green box. These are the same concepts for the levels in the red boxes as well.
The ends/vertical sides of the boxes are determined in a similar fashion. The peak of the rise can occur as soon as the next trading bar after signal close, while the max rise occurs within the limit of study at 35 trading bars after the signal. A 1% rise must occur over the next 35 trading bars in order to be considered a success. Three-quarters of successful movement occur after at least 16 trading bars; half occur within 24 trading bars, and one-quarter require at least 30 trading bars.
The black dotted arrow represents median historical movement. Medians are a good metric, but they are just one of many I use when forecasting future movement.
As always, the stock could decline the very next bar after the signal without looking back (therefore the red boxes would not come into play) or the stock may never decline (and the green boxes may never come into play).


Potential breakout Atmos Energy CompanyAtmos trading below 200ema and 50ema
Price target lowered to 110 from 113 by JP morgan. Currently trading at 89.
Looking at a massive 20% upside in the next few weeks.
Plan, get filled for 100c 4/16. tier out on resistance lines.
2020 2019
Net income $ 217,678 $ 178,673
(Form10-Q fillings)

ATO Technical Analysis 🧙Atmos Energy is the largest publicly traded, fully regulated, pure-play natural gas utility in the United States, serving more than 3 million customers in Texas, Colorado, Kansas, Kentucky, Louisiana, Mississippi, Tennessee, and Virginia. About 70% of its earnings come from Texas, where it distributes natural gas in northern Texas, including Dallas, and has a 5,700-mile intrastate gas transmission pipeline spanning several key shale gas formations and interconnected with five storage facilities.
If you want more trading ideas like this one,🎯 press a thumb up! 👍 Have a question? Don't be shy to ask! 🤓 Interested to study how to analyze charts, follow me!


Nice pullback for an entryATO has solid multi bottom support at 90-91 level. So we have a great long opportunity here with the targets around 96 and 100+

ATMOS ENERGY CORP Opinion DailyHey my freinds, ATMOS ENERGY CORP is in a bearish fake dynamic with a trace made of sellers and a return of buying volume. On the TIMEFRAME M1 we see a hammer candle with a large volume of sales exchanged it made a rebound on the VWAP. It goes on the top of the stabilization zone to test this one with a strong potential to breakout the price. At the same time breakout the area to reach a new one and reach the next higher. With several higher (on TIMEFRAME H4) and (on TIMEFRAME H1) before breakout of the new stabilization zone. Little buying power to test half of the middle median of ANDREWS PICHTFORK.
Please LIKE & FOLLOW, thank you!


$ATO with a bullish outlook after earnings$ATO has been projected with a bullish outlook after earnings negative under reaction placing the stock in Drift D.
If you would like to see the Drift for another stock please message us. Also click on the Like Button if this was useful and follow us or join us.

BUY to ATMOS ENERGY CORP DailyHey people, ATMOS ENERGY CORP is in a bearish fake conguration with low purchase volume made and a shadow of the top larger than the bottom one. The TIMEFRAME M1 shows an upside down hammer candle bull with low buy volume that starts from its last low point to turn around. Big possibility of breakout the price to go on the top following several resistances to passed with the last to test the intermediate median of ANDREWS PITCHFORK.
Please LIKE & FOLLOW, thank you!

AEP-0.89*ATO $ATO (Atmos Energy) $AEP (American Electric Power) Quantamental Tools for Proprietary and Retail Investors.
Statistical Arbitrage Opportunities Delivered to Your Inbox.
QuantChart. io
Short 100 $AEP
Long 89 $ATO

