Test ideaThis is a test idea
this is my idea of a test, I just want to see how this part of trading view is working
A2MB34 trade ideas


AMBA - Ambarella, Inc.Semiconductor solutions and design company with accelerating EPS and the sales to support growth.
Breakout of very long term base going back to 2015 after earnings report in August. Showing very good volume characteristics. Relative strength breaking out to new highs with stock taking out its pivot point.
100bps initial risk, willing to add if it begins to move higher.

AMBAAMBA confirmed breakout on weekly. I am expecting the above measured move after a blow out (unexpected) earnings report

$AMBA Ambarella Inc Fibonacci Breakout targets
Hopefully you find the chart helpful in terms of Supports & Resistance etc.
we refrain from adding commentary on the chart as that is reserved for our members and we are very conscious of not giving financial or trading advice.
Thank you for taking time to consult our chart and we would really appreciate a like, follow or comment.

$AMBA | Inverse Head and Shoulders Pattern [Update 1] The Inverse Head and Shoulders pattern on $AMBA is still intact. Price is also trading within a rising channel. Watch for a bounce to the upside.
Initial Targets: $106 | $111

ABC BullishEarnings are over.
Possible stop under support level or C but is a bit too far a way for some.
There may be a resistance zone not far above price.
No recommendation

$AMBA | Potential Inverse Head and Shoulders Pattern$AMBA is very close to completing and inverse head and shoulders pattern. Price is currently trading at a significant structure support. Watch for a bounce to the neckline.

Head and ShouldersPrice would need to break neckline in a confirmed downtrend.
Targets 2 39 to 23
No recommendation.
If price breaks the neckline, in an uptrend, this pattern would have failed as the neckline is now resistance. Bull markets and head and shoulders patterns do not co-exist well, so be safe.

Ugly TopHead and Shoulders with an extra shoulder. Head and shoulder or ugly tops do not do well in a bull market. Some will get to the neckline and the support of the neckline holds. Some may pierce the neckline but do not fall far. Inverse H&S do well in a bull market. The opposite is true in a bear market.
I would just be safe if I were to go long on AMBA. Everything changes, except change
No rcommendation
I have seen a lot of bearish top patterns go down then form a bullish bottom pattern and come back up lately.

$AMBA Ambarella Long to 130 Q1, RED ALERT LONG TERM VALUE GODLY- Computer Vision technologies (hot) and used in EV and robotics
- Partnership with Amazon for AI-powered cameras for EVs
- AI/CV chip sector (next big thing IMO)
- Whopping 77.5% Institutional ownership
- 60 Hedge Funds
- 200 Funds... Top ones being Blackrock, Vanguard and RENAISSANCE TECHNOLOGIES!
- Mcap 4Bn... Will be 100Bn at the least
- Extremely undervalued
- 33M float... very low
- I will be holding this long term along with PLTR, PSTG and SQ.
I see some pinning mischief in the short term by the MM and can see this correct a bit. Understandable, as this is incredible technology. More time to accumulate.
Do yourself a favor... throw this in the savings account along with Palantir, Pure Storage and Square. I also think Xperi is very good.
Long-term PT: $1000-$2000 (Pre-split)


AMBARELLA ChartHey people, AMBARELLA is in a dynamic fake bearish with a form of marubozu and a low volume of sales made. In TIMEFRAME M1 we see a hammer candle upside down with a large volume of purchase issued, it will turn on its lowest point for a fake test of the bollinger low. AMBARELLA starts from its base for a new test and then comes to the highest of the bollinger with test of the VWAP between a test of the top of the bearish channel. if it fails then the next attempt will be good.
Please LIKE & FOLLOW, thank you!

My Target Met, at least. Profit taken. I have been sharing this indication from a while ago. Been in it's tough days and held through, took some profits as it breaks new high.
This chart is like a no-brainer trade as it break the previous S&R levels. I dunno if it will keep breaking, but something must have to break this level in order to get higher. If it breaks again and retests my mark, I will get back in again- while the overall market is stable, of course.
GL trading! I just sold this TRADE couple sec and posted this. 11:45 EST.

US Stock In Play: $AMBA (Ambarella Inc)$AMBA have successfully broken out of the Bullish Ascending Triangle chart pattern highlighted last week, closing the session with an intraday rally of +8.86% at $108.19.
ATR-14 of $AMBA is currently at $5.42/day, a further 30% volatility increment since last week. This price volatility was last witnessed in 2015, where $AMBA did a parabolic run of 71.08% gain in 3 weeks before peaking at $128.

$AMBA - Super Duper Mega Breakout™ - $119.41 targetHuge call buying yesterday in the Feb19 $125C. More buying today in the January29 $120C. I followed both.
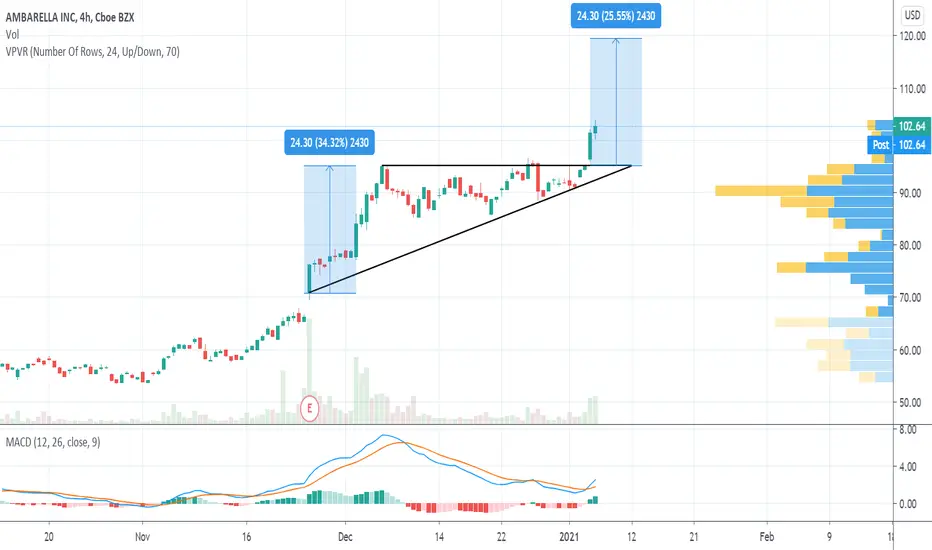
US Stock In Play: $AMBA (Ambarella Inc)$AMBA is currently undergoing a consolidation, morphing out a Bullish Ascending Triangle chart pattern with price remains resisted at $96 range over the past 5 weeks. It has previously broken out of a short term consolidated Bullish Flag chart pattern on 2nd December 2020, rallying from $80 to $95, a quick 20% increment in its absolute share price in just 3 trading days.
This morning's gain of +4.28% sees $AMBA closing at $95.25. With $AMBA currently trading at a daily average volatility of $3.96 The breakout of the aforementioned $96 resistance only require 20% of its daily average true range to be exhibited this week. $AMBA last traded $96 in August 2015.


$AMBA with a Neutral outlook following earnings releaseThe PEAD projected a neutral outlook for $AMBA after a positive under reaction following its earning release placing the stock in Drift A
If you would like to see the Drift for another stock please message us. Also click on the Like Button if this was useful and follow us or join us.

Big one (profit) or not? Long for itJust be patience with this one. I think the factor is easier business with JB on the stock. It was a good run during BO's run. Just a thought. And this thing broke the resistance, it will retest some lows still.

$AMBA Ambarella potential earnings Breakout
possible entry above previous high @74.50
Target price to fib 1.618 $84.50
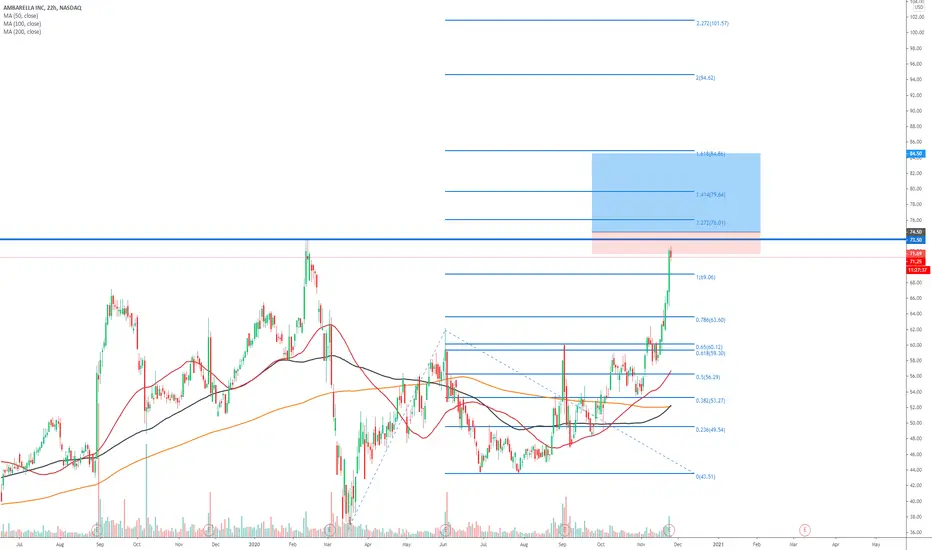
Cup and HandlePattern only valid at long entry level
Possible stop below Mid cup which is 52.9 or under handle low
This is an intra-year C&H pattern. Prior yearly high is 73.59 so there will most likely be R there
Just an observation
