An APPLE for $240Apple just broke the highest of all time and created a support on the previous resistance point.
It seems the bearish structure was a breather in order to escalate further to where it intended to move.
If on Monday it keeps the movement bouncing positively on the new support, I expect apple to reach $240+ this week. Watch out for some major news suddenly appearing within Tuesday or Wednesday to be able to justify the new highs.
AAPL34 trade ideas


APPLE: Short Trade Explained
APPLE
- Classic bearish formation
- Our team expects pullback
SUGGESTED TRADE:
Swing Trade
Short APPLE
Entry - 237.43
Sl - 242.19
Tp - 229.78
Our Risk - 1%
Start protection of your profits from lower levels
❤️ Please, support our work with like & comment! ❤️

APPLE... Buying opportunityUptrend
Apple has received to a s/r level price and passing out of this level could make a good buying position. Confirming above the trend line with a good bullish candle will be a good trigger for to get a buying position by setting AL below the trend line and mid term target at about 300-310.
Low risk traders can wait to a retest the get it but I will enter after confirming above the line.

Triple top pattern on $AAPL ?Seeing a possible triple top pattern on apple, this could have me going medium term bearish if it starts to roll over.
Average analyst prediction is around $244 and we are already quite near that although it should be considered a longer term prediction. Therefore it would be fair to expect some consolidation.
Volume doesnt seem to be significant enough to signify a breakthrough of this resistance.
Recent earnings had a negative surprise.
However, there is still a fair chance for it to breakout. Apple is always very consistently bullish, so even with some clear signals I cant be entirely certain.
Buying a small PUT position, could see a false breakout potentially but if it rolls over Ill increase position.

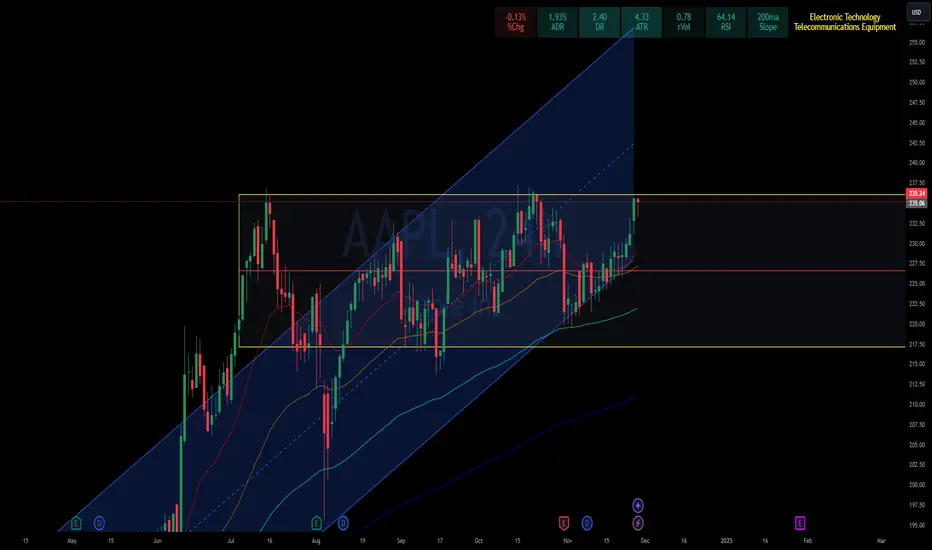
AAPL: 2025 Strategic Outlook: 75%+ BUY/HOLD🔸Time to update the AAPL outlook, this is 2D price chart, we are
currently entering overpriced zone and limited upside in AAPL
going forward.
🔸AAPL price action is contained within rising bullish price channel
established since 2021. Havin said that we've entered premium / overprice
zone and I'm expecting limited upside going forward over the next few
month. Risk/reward is favoring a pullback/correction before a healthy
uptrend can resume in 2025.
🔸Recommended strategy bulls: expecting pullback/correction to start
in Q1 2025, 20/25% pullback is normal and therefore we may hit
170/180 USD in the correction stage of the bull market in AAPL. Bulls
should wait for better prices / reload zone near 170/180. TP BULLS
is 260/280 USD. this is obviously a setup for patient traders, do not
expect overnight gains in this market. good luck!
🎁Please hit the like button and
🎁Leave a comment to support our team!
RISK DISCLAIMER:
Trading Futures , Forex, CFDs and Stocks involves a risk of loss.
Please consider carefully if such trading is appropriate for you.
Past performance is not indicative of future results.
Always limit your leverage and use tight stop loss.

AAPL: Eyeing the Channel Breakout – Reduced Market HoursTrading Plan and Technical Analysis for AAPL
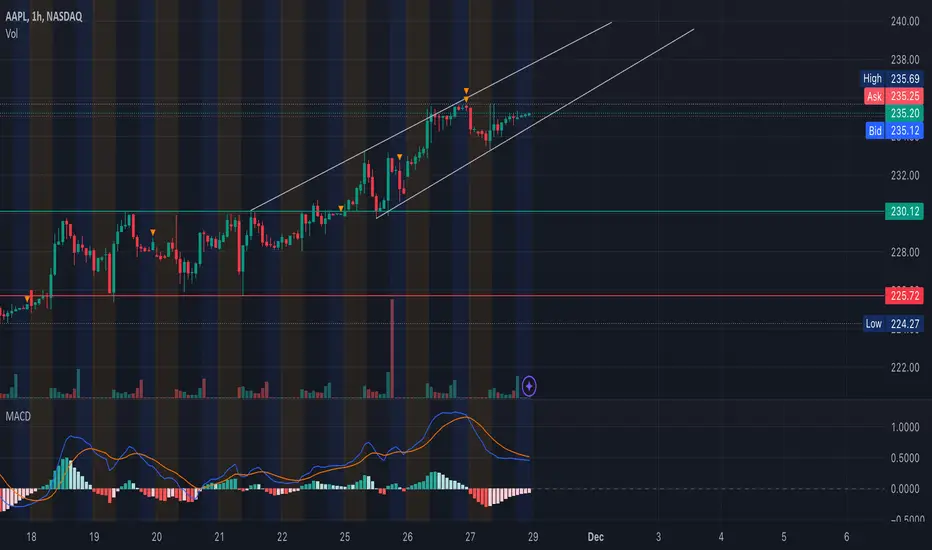
Price Action Overview: AAPL is consolidating near $235.25, maintaining its upward channel structure. Recent price action suggests the stock is gearing up for a potential breakout as it tests the upper boundary of the ascending channel. The MACD histogram is showing early signs of bullish momentum, while the volume remains consistent, hinting at possible accumulation.
Liquidity Zones and Order Blocks:
* Liquidity Zone (Support): $230.00-$231.00 - Buyers have been actively defending this area, establishing it as a strong demand zone.
* Liquidity Zone (Resistance): $236.50-$238.00 - Price rejection here would confirm a double-top pattern, but a breakout could invite significant upward movement.
Key Support and Resistance Levels:
* Support Levels:
* $233.50 - Intraday pivot level; watch for consolidation above this.
* $230.00 - Strong support where the lower channel line aligns.
* Resistance Levels:
* $236.00 - Immediate resistance aligning with the channel's upper boundary.
* $238.00 - Critical breakout level, marking potential for a new high.
Scalping Gameplan:
* Bullish Setup:
* Entry: Long above $236.00, targeting $237.50 and $238.50.
* Stop-loss: Below $235.00.
* Confirmation: Look for a 5-minute candle close above the channel with increased volume.
* Bearish Setup:
* Entry: Short below $233.00, targeting $231.50 and $230.00.
* Stop-loss: Above $234.00.
* Confirmation: Watch for rejection at the upper channel boundary followed by a breakdown.
Swing Trading Playbook:
* Bullish Case:
* Entry: Confirmed breakout above $236.50, holding for a target of $240.00.
* Stop-loss: Below $234.00.
* Indicators to Watch: RSI crossing above 60 and MACD line diverging upward.
* Bearish Case:
* Entry: If price fails to break $236.50 and reverses below $233.00, enter short.
* Target: $230.00 and potentially $228.00.
* Stop-loss: Above $235.00.
Thoughts and Suggestions: AAPL's current price action reflects cautious optimism as traders position themselves ahead of reduced market hours tomorrow. A breakout above the channel could lead to a quick surge, especially with volume confirmation. However, failure to breach resistance may result in a pullback to test support at $230.00. Scalpers should stay vigilant, especially during the first hour of trading, while swing traders can use breakout or rejection setups for multi-day positions.
Disclaimer: This analysis is for educational purposes only and not financial advice. Please consult a financial professional and conduct your own research before trading.
APPLE Potential Short! Sell!
Hello,Traders!
APPLE is about to retest
A horizontal resistance
Level of 237.20$ and
As it is a strong level
We will be expecting
A local bearish correction
Sell!
Comment and subscribe to help us grow!
Check out other forecasts below too!

AAPL Looks Good Short Term BuyNASDAQ:AAPL Looks great Entry 234.53, AAPL on Chart Shows Clear Buy and All Supporting Indicators showing positive trend.

AAPL Apple 24hr potterbox with a channel clearly going upAAPL Apple 24hr potterbox and channel clearly going up. trade accordingly . Apple might be fixing to break out. we shall see. I would be long on apple.
APPLE - Giant Weekly BullflagA great entry for long under the premise that this is a bullflag with a strong chance to break out to the upside.
It definitely looks like a bullflag to me.
Weekly timeframe so this is a long term buy.

$AAPL - all time resistance break we can see $250AAPL - all time could break for more upside. Stock is strong on indicators and having multiple green candle. Decent call flow coming in. Stock previous formed ascending triangle. looking for $250 above all time highs

AAPL: Is a Breakout Brewing? Complete Scalping and Swing TradeAAPL is trading at $235.41, consolidating near a key resistance zone within an ascending channel. This movement suggests a potential breakout or a pullback in the near term, offering both scalping and swing trading opportunities. Let’s dive into a structured game plan with actionable insights.
Technical Analysis
Market Structure & Price Action
* Trend: The stock is trading within a clear ascending channel, demonstrating bullish momentum. However, it’s nearing the upper trendline, suggesting a potential pause or correction.
* Liquidity Zones:
* Liquidity resides around $230-$232, where previous consolidation occurred. This could act as a magnet for price if a pullback occurs.
Key Levels to Watch
* Support Zones:
* $230.48-$229.75: Strong support zone, aligning with the midline of the ascending channel.
* $225.74: Critical support and potential stop-loss area for long trades.
* Resistance Zones:
* $235.65-$236: Immediate resistance; a breakout above this level may trigger further bullish momentum.
* $240: Psychological level and the next target for bullish continuation.
Scalping Plan
1. Entry Point:
* Enter long on a breakout above $236 with volume confirmation.
* Alternatively, scalp short if the price rejects $235.65, targeting $233.20.
2. Targets:
* Long Target: $238, then $240.
* Short Target: $233.20, then $230.48.
3. Stop-Loss:
* Tight stop-loss at $234.50 for longs.
* For shorts, stop-loss above $236.50.
Swing Trade Plan
1. Bullish Setup:
* Wait for a breakout above $236 and hold for $240 and beyond. Use $230.48 as the stop-loss level for swings.
2. Bearish Setup:
* Enter short if price breaks below $230, targeting $225.74. This would signal a breakdown from the ascending channel.
3. Volume Analysis:
* Volume will play a crucial role in confirming the breakout or breakdown. A spike in volume above $236 is bullish; declining volume during pullbacks favors the bulls.
Order Blocks and Liquidity Insights
* Bullish Order Block: Around $230, aligning with support levels and prior accumulation zones.
* Bearish Order Block: Near $236, coinciding with the resistance zone and potential liquidity grab.
Thoughts & Suggestions
1. Bullish Scenario:
* If AAPL clears $236 with volume, we could see a rally to $240 or even higher. The ascending channel supports this outlook.
2. Bearish Scenario:
* A rejection at $236 or a breakdown below $230 would attract selling pressure, potentially testing $225.74.
3. Scalpers and Swing Traders:
* Scalpers should focus on intraday price reactions at the outlined key levels.
* Swing traders can lean on the channel structure and broader bullish trend for position sizing and risk management.
Final Thoughts
Apple is sitting at a critical juncture within its ascending channel. Both bulls and bears have opportunities depending on how the stock reacts to key levels. Stay patient, watch volume, and plan your trades accordingly.
Disclaimer
This post is for educational purposes only and should not be considered financial advice. Always conduct your own research or consult a professional before making trading decisions.

Apple DOWN! Not Fruits or healthy food in MC DONALDS.We can see the selling volume some days ago, that was an important one, ¿WB?
Apple is retesting as the whole S&P seems to chop chop this quarter, remember that was going up when Crypto was Chopping.
Opened the short yesterday, with a tight SL just in case-
Let´s see.
Para pa pa pa Loving IT

APPLE RESISTANCE AHEAD|SHORT|
✅APPLE will soon retest a key resistance level of 237.35$
So I think that the pair will make a pullback
And go down to retest the demand level below at 232.00$
SHORT🔥
✅Like and subscribe to never miss a new idea!✅

Apple from 2014 vs Bitcoin nowApple from 2014 vs Bitcoin now
I don’t know the potential all-time high for the current BTC cycle, but if ~$5 trillion market cap = ~$260,000
If this cycle is really about mass adoption of Bitcoin, I think neither BlackRock (because of ETF) nor governments will let it fall too much in the bear market.
Basically, they will use it to accumulate more and won’t let BTC fall below important levels.

AAPL at important levelPrice has been moving up in a healthy uptrend (lower time frames) and it has been testing the 230 level many times now.
On Friday price broke above but failed to stay there. I am watching it at open tomorrow to see if we can push towards 233 by end of the week

AAPL Near Key Breakout Zone: Scalping & Swing Trade Plan Nov. 25AAPL is trading in a tight ascending range, approaching a critical resistance level. With increasing bullish momentum, it presents exciting opportunities for both scalping and swing trades. Here’s a detailed technical analysis and game plan to navigate the current price action.
Market Structure:
1. Trend Direction: AAPL is in a short-term ascending channel, with higher lows confirming bullish momentum.
2. EMA Analysis: The 9 EMA is positioned above the 21 EMA, indicating upward momentum on the hourly chart.
3. Volume Activity: Gradual volume increase on upward moves suggests growing buyer interest near resistance.
Key Levels:
* Resistance: $230.72, $234.00.
* Support: $228.05, $225.84.
Liquidity Zones:
* Demand Zone (Support): $228.00–$228.50. Buyers have consistently stepped in around this level.
* Supply Zone (Resistance): $230.50–$231.00. This area is a key level where sellers have been active.
Price Action Insights:
1. AAPL is forming an ascending triangle pattern, often a bullish continuation signal.
2. Resistance near $230.72 has been tested multiple times, making a breakout increasingly likely if volume supports it.
3. Rejection from this level could push the price back to the demand zone at $228 or lower to $225.84.
Order Blocks:
* Bullish Order Block: $228.00–$228.50. This area is likely to see strong buying interest if the price pulls back.
* Bearish Order Block: $230.50–$231.00. Sellers have actively defended this zone, and it remains the main hurdle for bulls.
Entry & Exit Suggestions:
For Scalping:
* Entry: Buy near $229.50 if the price bounces off the 9 EMA with bullish candles.
* Target: $230.50 (partial profits), $231.50 (final target).
* Stop-Loss: Below $228.50 to limit downside risk.
For Swing Trade:
* Bullish Scenario:
* Entry: Above $230.72 on a confirmed breakout with strong volume.
* Target: $234.00, followed by $236.00 for extended gains.
* Stop-Loss: Below $229 to minimize losses in case of a false breakout.
* Bearish Scenario:
* Entry: If price breaks below $228.00 with a strong bearish candle.
* Target: $225.84, followed by $224.00.
* Stop-Loss: Above $229.00 to avoid premature exits.
Thoughts & Projections:
* Bullish Outlook: AAPL looks poised to break out of its ascending triangle. A successful close above $230.72 could lead to strong upside momentum toward $234.
* Bearish Outlook: If resistance holds and price drops below $228.00, the focus shifts to downside targets near $225.84.
Playbook & Game Plan:
1. Pre-Market Prep:
* Highlight $228.00 and $230.72 on your chart.
* Monitor pre-market volume for signs of momentum in either direction.
2. Scalping Checklist:
* Look for strong price action near $229.50 or $230.50.
* Use the 9 EMA for trend confirmation.
* Take quick profits in case of high volatility.
3. Swing Checklist:
* Wait for confirmed breakouts with increased volume.
* Use higher time frames to validate support or resistance zones.
* Set conservative stop-loss levels to protect gains.
Conclusion:
AAPL’s current setup offers a great opportunity for both scalpers and swing traders. Watch for a breakout above $230.72 for bullish continuation or a breakdown below $228 for bearish moves. Stick to your game plan and manage risk carefully.
Disclaimer:
This analysis is for educational purposes only and should not be considered financial advice. Always perform your own research and manage your risk before trading.
Dear

Apple Inc. (AAPL) short term outlookApple Inc. (AAPL) is exhibiting an ascending triangle pattern on its daily chart, a formation that often precedes a bullish breakout. The chart shows a horizontal resistance level around $235, where the stock has encountered selling pressure multiple times, while higher lows form a rising trendline. This pattern reflects increasing buying interest and suggests a potential upside move if the resistance is decisively broken.
A breakout above the $235 resistance level, particularly if accompanied by higher trading volume, could signal the start of a strong upward trend. Traders may look for confirmation of the breakout with a daily close above resistance, supported by robust volume to validate the move.
For risk management, stop losses could be placed below the ascending trendline or the most recent higher low. Profit targets can be projected using the height of the triangle added to the breakout level, providing potential upside targets in the $245–$250 range.
While this setup is promising, it’s essential to remain cautious and monitor market conditions, as broader market movements or news events could impact the stock's trajectory. Using proper risk management strategies will be critical when trading this pattern.

APPLE The Target Is DOWN! SELL!
My dear followers,
I analysed this chart on APPLE and concluded the following:
The market is trading on 229.82 pivot level.
Bias - Bearish
Technical Indicators: Both Super Trend & Pivot HL indicate a highly probable Bearish continuation.
Target - 226.87
About Used Indicators:
A super-trend indicator is plotted on either above or below the closing price to signal a buy or sell. The indicator changes color, based on whether or not you should be buying. If the super-trend indicator moves below the closing price, the indicator turns green, and it signals an entry point or points to buy.
———————————
WISH YOU ALL LUCK

APPLE TRADE IDEAApple starting to look good here. The stock has been consolidating since July creating higher lows.
Looks like an ascending triangle is forming with 237 level being the main resistance. MAs are curling, RSI divergence and the SRA technical indicator are leaning towards a bullish move incoming.
Long term trend line since April has been acting has a very nice support. I expect ATHs once we break the 237 level.
DYOR.

Top 5 Weekly Trade Ideas #5 - Mag 7 ResistanceThe mag 7 finally moved down for a retest of the previous ATH/supply I had been watching for a while. Got a nice bounce up to the gap fill before stalling out. Now we're coming back into the area again. This will have a big impact on SPY and QQQ so it's an important watch. It will either break this resistance here and fuel the market higher or potentially reject back down to the 2,000 area.

How to use Trading View - Part 3 - TemplatesHow to use Trading View - Part 3 - Templates
Easily switch your TF, Scrip and indicators with the help of templates.
These template help save time and ensure you don't miss out on any indicators/Time Frames or Opportunities.
