$AAPL laggard to the upside?All of the tech stocks recently have had a large moves to the upside, yet Apple has yet to have one. I think Apple is lagging the other names and is likely to have the same kind of move to the upside.
I rarely trade short term, but this one seems like a good setup.
I took a trade for 6/6 $235C to express this view.
Let's see if it plays out.
AAPL34 trade ideas

Apple Stock Heist Blueprint – Precision Buy Setup Unlocked!🏴☠️ Apple Stock Heist: The Stealthy Long Setup
🎯 Entry Zone – Loot the Dip!
Current Price: $200.21
Action: Initiate long positions now or target pullbacks near the $193–$190 support zone.
Pro Tip: Place buy limits near swing lows/highs. Utilize chart alerts as your secret weapon.
🛡️ Stop Loss – Guard the Treasure!
Swing Traders: Position stop loss below the $190 support level.
Day Traders: Adjust stop loss according to your risk tolerance and order count.
TECHi
💰 Profit Target – Escape with the Loot!
Primary Target: $210 resistance zone.
Secondary Target: $227–$230 range.
⚔️ Scalpers vs. Swing Traders – Choose Your Weapon!
Scalpers: Focus on quick strikes. Enter long positions and exit swiftly.
Swing Traders: Trail stops and lock in gains as the price moves in your favor.
🌪️ Market Pulse – Bullish Winds Blowing!
Technical Indicators: Price is supported near $201, with potential to bounce back toward local resistance at $213.
RSI: Approximately 35 on the 1-hour timeframe, indicating oversold conditions and potential for a rebound.
TradingView
⚠️ News Trap Warning!
Upcoming Events: Monitor for any high-impact news that may affect Apple's stock price.
Strategy: Freeze trades or tighten stops ahead of major announcements.
🚨 Join the Trading Crew!
Engage: Like 👍 or Boost 🚀 this idea to fuel our next raid.
Support: Your engagement keeps the strategies alive!
🤑 Stay Locked In – The Next Big Score is Coming…
Timing: Watch the charts closely.
Action: Strike hard. Exit smarter.

APPLE Index Stock Chart Fibonacci Analysis 052625Trading Idea
1) Find a FIBO slingshot
2) Check FIBO 61.80% level
3) Entry Point > 200/61.80%
Chart time frame:D
A) 15 min(1W-3M)
B) 1 hr(3M-6M)
C) 4 hr(6M-1year)
D) 1 day(1-3years)
Stock progress: B
A) Keep rising over 61.80% resistance
B) 61.80% resistance
C) 61.80% support
D) Hit the bottom
E) Hit the top
Stocks rise as they rise from support and fall from resistance. Our goal is to find a low support point and enter. It can be referred to as buying at the pullback point. The pullback point can be found with a Fibonacci extension of 61.80%. This is a step to find entry level. 1) Find a triangle (Fibonacci Speed Fan Line) that connects the high (resistance) and low (support) points of the stock in progress, where it is continuously expressed as a Slingshot, 2) and create a Fibonacci extension level for the first rising wave from the start point of slingshot pattern.
When the current price goes over 61.80% level , that can be a good entry point, especially if the SMA 100 and 200 curves are gathered together at 61.80%, it is a very good entry point.
As a great help, tradingview provides these Fibonacci speed fan lines and extension levels with ease. So if you use the Fibonacci fan line, the extension level, and the SMA 100/200 curve well, you can find an entry point for the stock market. At least you have to enter at this low point to avoid trading failure, and if you are skilled at entering this low point, with fibonacci6180 technique, your reading skill to chart will be greatly improved.
If you want to do day trading, please set the time frame to 5 minutes or 15 minutes, and you will see many of the low point of rising stocks.
If want to prefer long term range trading, you can set the time frame to 1 hr or 1 day.

APPLE On The Rise! BUY!
My dear friends,
APPLE looks like it will make a good move, and here are the details:
The market is trading on 195.23 pivot level.
Bias - Bullish
Technical Indicators: Supper Trend generates a clear long signal while Pivot Point HL is currently determining the overall Bullish trend of the market.
Goal - 208.29
Recommended Stop Loss - 187.61
About Used Indicators:
Pivot points are a great way to identify areas of support and resistance, but they work best when combined with other kinds of technical analysis
Disclosure: I am part of Trade Nation's Influencer program and receive a monthly fee for using their TradingView charts in my analysis.
———————————
WISH YOU ALL LUCK

Apple: Wave [2] Correction We now consider the dark green wave to be complete and thus place AAPL in the intermediate corrective movement of wave , which can be further subdivided into waves (A), (B), and (C) in magenta. Currently, only the last part of this (C) wave should be missing before the next impulsive uptrend unfolds towards the previous all-time high. We must still weigh our alternative scenario with a 34% probability: If the price falls below support at $168, this scenario with a new low for the blue wave alt.(IV) would be confirmed, although in this case, the price should not fall significantly below our previous Target Zone.
📈 Over 190 precise analyses, clear entry points, and defined Target Zones - that's what we do.

AAPL Stock Trading Plan 2025-05-25AAPL Stock Trading Plan (2025-05-25)
Final Trading Decision
Models’ Key Points
DS Report
Technical: Strong bearish—price ($195.27) below all EMAs (10/50/200) on M30/daily/weekly; RSI oversold but in downtrend; bearish MACD; hugging lower Bollinger band. Sentiment: Rising VIX (22.29), negative tariff news, heavy institutional distribution. Trade: Short at $195.27; target $189.56; stop $197.50; 3–4 week hold; confidence 70%.
LM Report
Technical: Bearish price vs EMAs; RSI near oversold; Bollinger lower‐band touch hints at bounce; bearish MACD. Sentiment: Elevated VIX; negative headlines. Trade: No trade—mixed oversold/bearish signals; confidence 55% (below 60% threshold).
GK Report
Technical: Bearish across daily/weekly; RSI approaching oversold; MACD bearish but weakening; Bollinger lower‐band proximity. Sentiment: Rising VIX; tariff news headwind. Trade: Short at $195.00; target $189.56; stop $200.35; 4 week hold; confidence 65%.
GM Report
Technical: Multi‐timeframe bearish—price below EMAs M30/daily/weekly; RSI oversold short‐term; strong bearish MACD. Sentiment: VIX up; negative tariff/profit‐risk headlines; 5-day −7.6% drop. Trade: Short at $195.00; target $187.50; stop $198.90; 3–4 week hold; position sizing example 25 shares on $10k equity; confidence 85%.
CD Report
Technical: Bearish across timeframes; RSI oversold; lower Bollinger band; MACD bearish but showing early convergence. Sentiment: Elevated VIX; tariff threat. Trade: Short at $195.27; target $189.56 (secondary $185.00); stop $202.41; 3–4 week hold; confidence 72%. Agreement and Disagreement
Agreement
Broadly bearish technical setup: price below key EMAs; bearish MACD; lower‐band Bollinger action. Negative fundamental catalyst: potential tariffs and geopolitical risk. Rising VIX supports risk‐off bias. Recommendation skewed toward shorting AAPL shares.
Disagreement
LM sees too much mixed signal (oversold + bearish) to trade; all others recommend a short. Entry divergences: $195.00 vs. $195.27. Stop‐loss levels range from $197.50 up to $202.41. Take-profit levels range from $189.56 down to $185.00 (secondary) or $187.50. Confidence varies 65%–85%. Conclusion
Overall Market Direction Consensus: Strongly Bearish
Recommended Trade
Strategy: Short AAPL shares Holding Period: 3–4 weeks Entry Timing: At market open (~$195.00) Position Sizing: Risk 1% of trading capital (e.g., 25 shares on a $10 000 account; scale accordingly) Entry Price: 195.00 Stop‐Loss: 198.90 (≈2% above entry; sits above recent resistance) Take‐Profit: 187.50 (below key support for a ~3.8% move) Confidence Level: 85%
Key Risks and Considerations
Severe oversold conditions could trigger a technical bounce. AAPL’s strong balance sheet may limit downside if market stress eases. Tariff news or policy reversal could abruptly shift sentiment. Monitor VIX and major support at $189.56 for early signs of exhaustion.
TRADE_DETAILS (JSON Format) { "instrument": "AAPL", "direction": "short", "entry_price": 195.00, "stop_loss": 198.90, "take_profit": 187.50, "size": 25, "confidence": 0.85, "entry_timing": "open" }
📊 TRADE DETAILS 📊 🎯 Instrument: AAPL 📉 Direction: SHORT 💰 Entry Price: 195.0 🛑 Stop Loss: 198.9 🎯 Take Profit: 187.5 📊 Size: 25 💪 Confidence: 85% ⏰ Entry Timing: open
Disclaimer: This newsletter is not trading or investment advice but for general informational purposes only. This newsletter represents my personal opinions based on proprietary research which I am sharing publicly as my personal blog. Futures, stocks, and options trading of any kind involves a lot of risk. No guarantee of any profit whatsoever is made. In fact, you may lose everything you have. So be very careful. I guarantee no profit whatsoever, You assume the entire cost and risk of any trading or investing activities you choose to undertake. You are solely responsible for making your own investment decisions. Owners/authors of this newsletter, its representatives, its principals, its moderators, and its members, are NOT registered as securities broker-dealers or investment advisors either with the U.S. Securities and Exchange Commission, CFTC, or with any other securities/regulatory authority. Consult with a registered investment advisor, broker-dealer, and/or financial advisor. By reading and using this newsletter or any of my publications, you are agreeing to these terms. Any screenshots used here are courtesy of TradingView. I am just an end user with no affiliations with them. Information and quotes shared in this blog can be 100% wrong. Markets are risky and can go to 0 at any time. Furthermore, you will not share or copy any content in this blog as it is the authors' IP. By reading this blog, you accept these terms of conditions and acknowledge I am sharing this blog as my personal trading journal, nothing more.

Apple: Fading The First Bounce After A New Momentum LowPrice momentum made a new low on 9 April 2025. There is a positive expectation in fading the first bounce after with at least a target to retest that last swing low. A possible extension past it and start of a new leg lower also can occur as momentum tends to lead price.

Fire sale on $AAPL incomingCurrently breaking lower looking like a bear flag dealio but I suspect it will be bought hard at support near the yearly low and I will add to long term account at that time sight unseen. Tariffs in US, fine, they have 700 billion people they can sell to and you gonna buy iPhone 17,18,19 and 20 anyway.

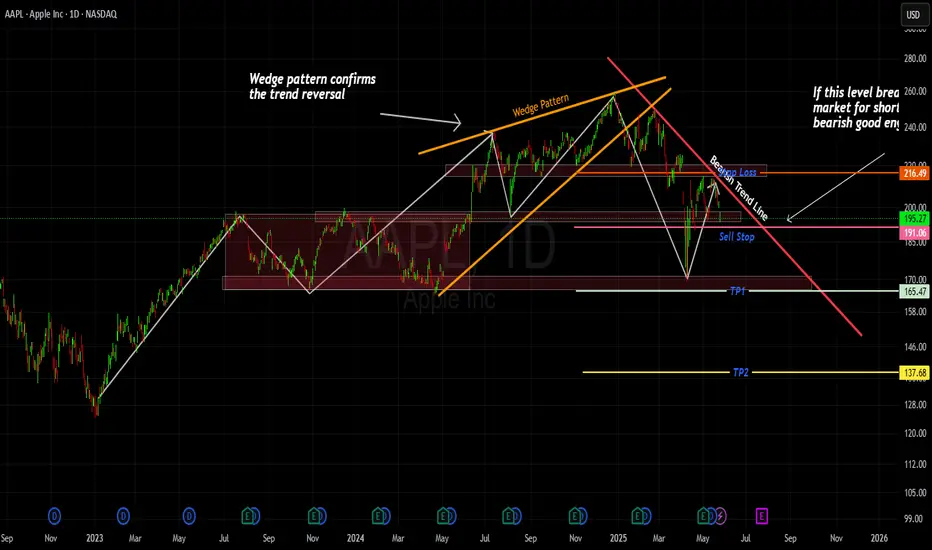
APPLE SHARE - WHY BEARISH !!!!! Chart Story Tell That.Price action of Apple Shares looks bearish, atleast until level of 165.59 which is strong support. market has formed wedge pattern before taking a bearish run. it has further good support of 216 and then previous HL of the longer bull trend.
we are looking for selling opportunity if the market breaks the 191 support level. we can easily target TP1 of 216 and if that further breaks then we can plan TP2 as marked accordingly.
But the question is , why APPLE getting down > ?
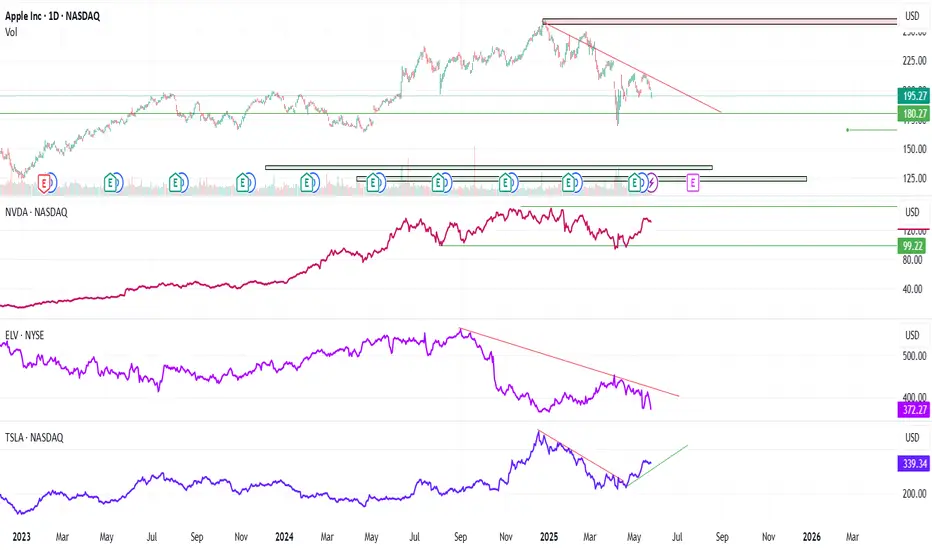
Weekly Watch – AAPL | NVDA | ELV | TSLAMacro remains shaky (Fed minutes + inflation data ahead), but selective strength in AI and healthcare continues. Watching these 4 tickers for technical and news-driven setups this week:
🍏 AAPL (Apple)
Apple’s holding up well, but facing some noise from EU antitrust investigations and softer iPhone demand in China. Still a solid name, but could move sideways unless big tech rallies.
Levels to watch:
📉 Support: 183–185
📈 Resistance: 192–195
🤖 NVDA (NVIDIA)
Post-split volatility is normal, but the AI demand is still massive. Analysts are staying bullish after last earnings.
Levels to watch:
📉 Support: 110–115
📈 Resistance: 125–130
🏥Elevance Health Inc. (Current Price: $372.27
ELV is under pressure following a class-action lawsuit related to increased medical costs in its Medicaid business . The stock has seen a notable decline, but it remains a key player in the healthcare sector.
Key Levels:
Support: $357–$360
Resistance: $390–$400
Potential for rebound if legal concerns are mitigated; monitoring for signs of stabilization.
⚡ Tesla Inc. ( NASDAQ:TSLA )
Current Price: $339.34
Tesla's stock is experiencing volatility amid discussions about its robotaxi launch, which analysts believe could significantly boost the stock . However, concerns about pricing strategies in China and regulatory scrutiny persist.
Key Levels:
Support: $330–$335
Resistance: $350–$360
Feel free to share your thoughts or ask questions in the comments below! Let's navigate the markets together. 🚀
⚠️ Disclaimer: This post is for educational purposes only and does not constitute financial
advice. Always conduct your own research before making investment decisions.
APPLE: Bullish Continuation & Long Trade
APPLE
- Classic bullish pattern
- Our team expects retracement
SUGGESTED TRADE:
Swing Trade
Buy APPLE
Entry - 195.23
Stop - 188.82
Take - 206.74
Our Risk - 1%
Start protection of your profits from lower levels
Disclosure: I am part of Trade Nation's Influencer program and receive a monthly fee for using their TradingView charts in my analysis.
❤️ Please, support our work with like & comment! ❤️

Apple losing $3Trillion clubNASDAQ:AAPL lost a fair amount of market share this week.
Coming under pressure from comments by Trump and tarrif news.
Apple seems to be a target for the president despite him answering a call on live TV today using an Iphone...kinda ironic.
Apple could easily chop in this 9% range before it makes a definitive move.
I lean more bullish since we're testing the lows of the trade range.
If Apple holds here it could be forming a right shoulder for a very bul,ish inverse head and shoulder pattern.

AAPL Mid term supportApple (AAPL) remains a strong player in the market, but whether it's a "buy" depends on various factors. Analysts have noted that Apple continues to generate impressive revenue, but its growth rate has slowed compared to competitors. The company is investing heavily in artificial intelligence and has maintained a strong dividend history1. Some experts believe Apple is fairly valued at around $200 per share, with potential risks related to tariffs.
If you're considering investing, it might be worth reviewing Apple's latest earnings, growth strategy, and broader market conditions. You can check out more details here and here. Let me know if you want a deeper dive into any specific aspect!

Ascending triangle pattern on daily?An ascending triangle is forming on the daily chart, resistance at ~211 USD, indicating that selling momentum is diminishing. Although there may be some further downside, recent economic pressures are leading to a healthy correction towards a long-term support trend that dates back to 2019. With some positive economic tailwinds, Apple could potentially offer good returns from this buying point.

AAPL. LONG@193. SHORT@200. LONG@184. SHORT@206. May 23 2025. Overview -
Trump has announced that AAPL needs to pay 25% to the US for manufacturing the iPhone in India and not in the US.
The stock is currently trading at 194.32
IF-THEN STATEMENTS (INTRADAY PLAN) -
1. If the 193 level is held - we go long till 195-197.
2. If the price fakes out high to 195-197 - we wait for a sell confirmation (e.g. buyers being absorbed or selling pressure) and we go short.
3. If the 193-195 level is consolidating but with high selling aggression - we go short till 184 area.
4. If the 193 level doesn't hold at all - we wait for a second attempt and get an entry off of the VWAP, if possible. We stay bearish for the entire day (with 184 being out next potential pivot).

APPLE Down -4% premarket on Trump's 25% Tariff. Buy opportunity?Apple Inc. (AAPL) is down -4% on pre-market trading following a warning by U.S. President Donald Trump that the company would have to pay a 25% tariff if phones sold in the U.S. were not made within its borders.
Along with a proposed 50% Tariff on goods from the European Union starting on June 01, these news have inflicted fear again in the markets following 6 weeks of a relief rebound on trade deal talks.
So are these announcements a dip buy opportunity for Apple or round 2 of correction?
Based on the stock's long-term pattern, which is a Channel Up, the recent rebound on the 1W MA200 (orange trend-line) is technically the start of its 2nd Bullish Leg. With the Bearish Legs having similar declines (-35% and -32% respectively), we can expect the Bullish Legs to have a proportional rise as well.
On top of that, the 1W RSI rebounded on its multi-year Support, while the 1W MACD is about to form a Bullish Cross.
As a result, since the 2023 Bullish Leg that was complete on July 17 2023 almost touched the 1.236 Fibonacci extension, we expect the price to disregard the news and continue rising up to the new 1.236 Fib and target $285.00.
-------------------------------------------------------------------------------
** Please LIKE 👍, FOLLOW ✅, SHARE 🙌 and COMMENT ✍ if you enjoy this idea! Also share your ideas and charts in the comments section below! This is best way to keep it relevant, support us, keep the content here free and allow the idea to reach as many people as possible. **
-------------------------------------------------------------------------------
💸💸💸💸💸💸
👇 👇 👇 👇 👇 👇

BUY OPPORTUNITYTrade Signal: AAPL (Apple Inc.)
Buy Entry Price: $201.20
Take Profit (TP): $212.43
Stop Loss (SL): $197.00
Technical Analysis:
Price has formed an ascending triangle pattern, a bullish continuation signal.
The stock is supported near $201 and expected to bounce back toward local resistance at around $213.
The RSI is at approximately 35 in 1Hr frame, indicating the stock is in the oversold territory, which suggests a potential rebound.
Fundamental Analysis:
Goldman Sachs maintains a Buy rating with a price target of $253, reflecting strong confidence in Apple’s growth prospects.
Apple’s upcoming WWDC 2025 Keynote (June 9th) is anticipated to showcase advancements in AI integration within its operating systems.
Expected announcements include developer access to Apple’s AI models and possible Gemini AI integration on iPhones.
Analyst optimism is supported by potential partnership talks with Alphabet (Google), aiming to finalize by mid-2025.
However, Apple must demonstrate continued success in its AI initiatives (Apple Intelligence) to drive demand and justify investor enthusiasm.

AAPL SwingYou can get in when it hits the trend support line then get out when it's in that resistance zone.

Apple (AAPL) share price slips towards psychological $200 levelApple (AAPL) share price slips towards psychological $200 level
Yesterday, Apple shares (AAPL) fell by 2.5%, edging closer to the key psychological threshold of $200. Moreover, the stock is underperforming the broader market, which reached new highs earlier this week — a move AAPL has yet to replicate.
Why is AAPL’s stock price declining?
According to media reports, investors may have grown concerned after OpenAI acquired a startup founded by Jony Ive, Apple’s former chief designer, for $6.5 billion.
The move is being interpreted as OpenAI’s first step toward launching a physical AI-powered device — one that could, eventually, pose a challenge to Apple’s hardware, even if not in the near term.
Technical analysis of the AAPL chart
Bulls may be hoping the AAPL price finds support at the confluence of two key levels:
→ the psychological $200 mark;
→ support from the second half of May (the lower blue trendline).
However, the broader technical context raises some bearish concerns:
→ the $215–222 zone, which previously acted as support, is now capping price advances (as highlighted by the arrows);
→ the red descending channel appears to define the current trend trajectory — and its relevance may be reinforced if the price drops and consolidates near its median line, signalling a balance between buying and selling pressure.
This article represents the opinion of the Companies operating under the FXOpen brand only. It is not to be construed as an offer, solicitation, or recommendation with respect to products and services provided by the Companies operating under the FXOpen brand, nor is it to be considered financial advice.

AAPL fractalThis whole year has been sort of a fractal for 2020 through 2022 for AAPL. Kind of crazy if you look at it. Lots of 5 wave falling wedges this year, and actually 2022 was one big falling wedge, sort of.
Expecting one more drop and then it's bull market back on. Can't believe I'm saying that but that's what the charts say.

AAPL Opportunity Behind the Noise🍏Apple’s trading around $205, and while it’s not at bargain basement levels, there’s real opportunity if you look beyond the headlines.
📰 What’s going on?
Trump’s back in the news pushing for Apple to shift iPhone production back to the U.S. and markets don’t like it. But here’s the thing: Apple’s already working on reducing China risk by moving production to India and ramping up AI features. The long-term vision? Still solid.
📊 The setup I’m watching:
Entry levels:
🔹 $194 – Light buy
🔹 $180 – Add with confidence
🔹 $166 – Back up the truck?
Targets:
🎯 $209 – Easy bounce
🎯 $230 – Mid-term strength
🎯 $260+ – Full recovery mode
💡 Why I like this play:
Apple isn’t just a phone company. It’s a cash-flow machine sitting on mountains of capital, pushing hard into AI, and building a services empire. Tariff talk can shake the chart, but that’s often when smart entries happen.
⚠️ Disclaimer: This is not financial advice—just sharing my personal trade plan. Do your own research and always protect your capital.
If you're waiting for the "perfect" moment, you might just miss the move. Stay alert. 📈💬

APPLE I Stock Forecast and Price Target Welcome back! Let me know your thoughts in the comments!
** APPLE Analysis - Listen to video!
We recommend that you keep this pair on your watchlist and enter when the entry criteria of your strategy is met.
Please support this idea with a LIKE and COMMENT if you find it useful and Click "Follow" on our profile if you'd like these trade ideas delivered straight to your email in the future.
Thanks for your continued support!Welcome back! Let me know your thoughts in the comments!

$AAPL
NASDAQ:AAPL holding strong above $198 support.
As long as it stays above that level, bullish momentum could continue to build.
Eyes on volume and market sentiment.
#AAPL #StockMarket #TechStocks #Investing
