Apple respite before sell offApple bounced straight of major support at circa $170, with the SMI now also rising we could see a few weeks of short term respite before continuing down to test the major support line again. Also notice a backtest of the rising trend at around 21%.
Long term view is still bearish, don't think we've seen the yearly bottoms yet. Will be interesting to see how this plays out especially with bonds.
AAPL34 trade ideas

$AAPL 4-Hour Chart Breakdown – Pullback in Play?Apple’s recent surge may be stalling. On the 4H chart (shown), the candles are beginning to reject resistance and rolling over from the highs around $213. I believe we are entering a short-term downward phase, with price likely to revisit the $205 area before any meaningful bounce.
MACD has just turned positive on the daily — but the weak histogram suggests the move may lack conviction.
RSI is beginning to fade from its highs earlier this week — confirming momentum loss.
Watch for a move toward $205 as a potential retest of the previous breakout zone.
If buyers fail to defend that level, further downside could unfold. A confirmed bounce from that zone, however, could set up a great long opportunity. Let’s see how price behaves.
Thoughts? Drop yours below

AAPL watch $218 above $208 below: Key bounds into EarningsAAAPL to release a consequential earnings report today.
We have well proven fibs and zones to watch for reaction.
What happens here may well define the next 1-4 YEARS.
$ 217.86-219.87 above is immediate resistance
$ 208.26-208.68 is tested but tired support.
$ 196.65-197.33 is a good stop-hunt support.
==================================================
.

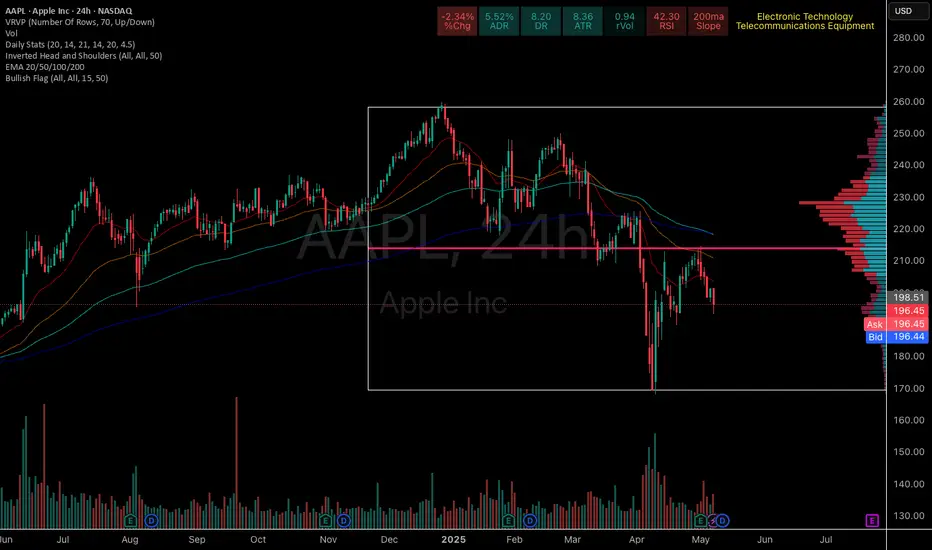
Apple Might Be StuckThe broader market has rebounded sharply in the last month, but Apple might be getting left behind.
The first pattern on today’s chart is the April 15 peak of $212.94. The smartphone giant probed that level in early May and again last week without breaking it. (The more recent high was also slightly lower.) That may suggest resistance is in place.
Second, the Nasdaq-100 and S&P 500 are back to levels from late February and early March. AAPL’s smaller bounce compared with the broader market may reflect weaker relative strength.
Third, the stock is below its 200-day simple day moving average (SMA). That also contrasts with the bigger indexes, which are above their respective 200-day SMAs.
Fourth, the 50-day SMA had a “death cross” below the 200-day SMA in early April and has remained there since.
Next, stochastics are dipping from an overbought condition.
Finally, AAPL is one of the most active underliers in the options market. (Its average volume of 1.1 million contracts ranks third in the S&P 500, according to TradeStation data.) That could help traders take positions with calls and puts.
TradeStation has, for decades, advanced the trading industry, providing access to stocks, options and futures. If you're born to trade, we could be for you. See our Overview for more.
Past performance, whether actual or indicated by historical tests of strategies, is no guarantee of future performance or success. There is a possibility that you may sustain a loss equal to or greater than your entire investment regardless of which asset class you trade (equities, options or futures); therefore, you should not invest or risk money that you cannot afford to lose. Online trading is not suitable for all investors. View the document titled Characteristics and Risks of Standardized Options at www.TradeStation.com . Before trading any asset class, customers must read the relevant risk disclosure statements on www.TradeStation.com . System access and trade placement and execution may be delayed or fail due to market volatility and volume, quote delays, system and software errors, Internet traffic, outages and other factors.
Securities and futures trading is offered to self-directed customers by TradeStation Securities, Inc., a broker-dealer registered with the Securities and Exchange Commission and a futures commission merchant licensed with the Commodity Futures Trading Commission). TradeStation Securities is a member of the Financial Industry Regulatory Authority, the National Futures Association, and a number of exchanges.
Options trading is not suitable for all investors. Your TradeStation Securities’ account application to trade options will be considered and approved or disapproved based on all relevant factors, including your trading experience. See www.TradeStation.com . Visit www.TradeStation.com for full details on the costs and fees associated with options.
Margin trading involves risks, and it is important that you fully understand those risks before trading on margin. The Margin Disclosure Statement outlines many of those risks, including that you can lose more funds than you deposit in your margin account; your brokerage firm can force the sale of securities in your account; your brokerage firm can sell your securities without contacting you; and you are not entitled to an extension of time on a margin call. Review the Margin Disclosure Statement at www.TradeStation.com .
TradeStation Securities, Inc. and TradeStation Technologies, Inc. are each wholly owned subsidiaries of TradeStation Group, Inc., both operating, and providing products and services, under the TradeStation brand and trademark. When applying for, or purchasing, accounts, subscriptions, products and services, it is important that you know which company you will be dealing with. Visit www.TradeStation.com for further important information explaining what this means.

The TradingView Show with TradeStation: Bull Market or Fake Out?Join us for a timely TradingView live stream with David Russell, Head of Global Market Strategy at TradeStation, as we break down the latest rebound in the markets and what it could mean for traders and investors. In this session, we’ll dive into:
What the recent bounce off the lows might signal about a potential bull market return
How global trade dynamics and tariff news are shaping asset prices
Key charts, indicators, and technical patterns to watch for signs of sustained momentum
Essential strategies for navigating market recoveries, corrections, and upcoming Federal Reserve decisions
Bonus: Discover our latest broker integration update with TradeStation—now supporting equity options trading directly on TradingView. This upgrade brings advanced tools like the strategy builder, options chain sheet, and volatility analysis to your fingertips, making it easier to trade through uncertain market conditions.
This session is sponsored by TradeStation, whose vision is to provide the ultimate online trading platform for self-directed traders and investors across equities, equity index options, futures, and futures options markets. Equities, equity options, and commodity futures services are offered by TradeStation Securities Inc., member NYSE, FINRA, CME, and SIPC.
Disclosures from TradeStation:
www.tradestation.com
www.tradestation.com

APPL 1H Trade Plan for Buy and Sell on Support and Resistance
Apple 1 Hour Time-Frame
Trade Plan to Buy at Support and Sell at Resistance

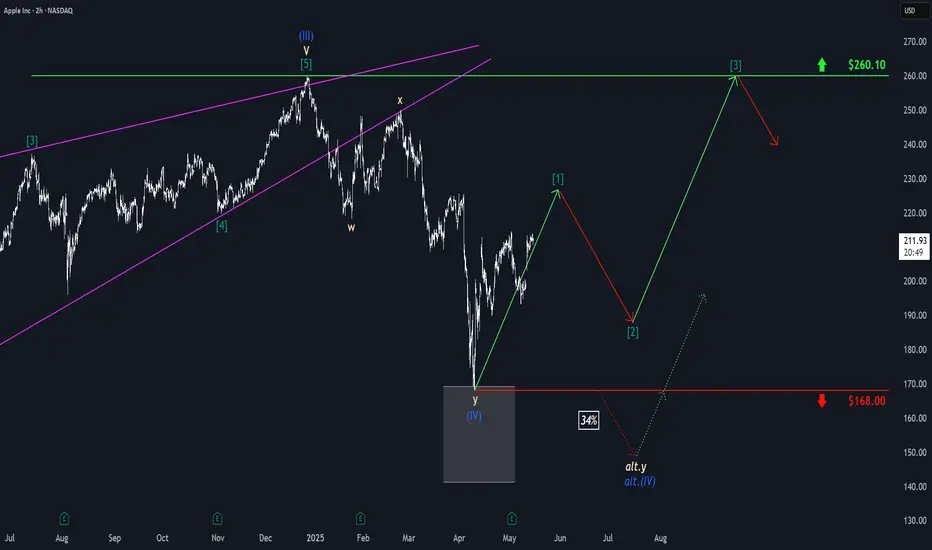
Apple: Wave [1] IntactDespite a significant setback, Apple managed to gather new momentum on the upside and continue its work on the green wave . The impulse structure remains intact, and we expect a new high imminently before the next countermovement with wave follows. The stock should not breach the support at $168 to enable wave to initiate the next upward phase. If the price does fall below the $168 mark, our 34% likely alternative scenario will allow for a new low of wave alt.(IV) in blue, though the rise would also continue after this lower low.
AAPL Trade Plan – 2025 Outlook📊With global markets reacting to renewed tariff talk from Trump, Apple (AAPL) NASDAQ:AAPL could face short-term volatility—but that’s also opportunity. As fears of a trade war ripple across Asia and Europe, AAPL may temporarily dip, especially with supply chain exposure in China.🍏📉📈
📌 Entry Zones (Buy the fear, not the panic):
1️⃣ 194 – Light entry as weakness sets in
2️⃣ 180 – Strong support historically
3️⃣ 166 – High-conviction zone if macro panic escalates
🎯 Profit Targets (Scale out as strength returns):
✅ 209 – Quick recovery zone
✅ 230 – Pre-fear valuation
✅ 260+ – Full macro recovery with bullish momentum
📈 Strategy: Let the news create emotion. You trade the levels.
⚠️ DISCLAIMER: This is not financial advice. Just sharing my personal trading plan based on current macro trends and technicals. Always do your own research and manage your risk.

AAPL | Apple Stock | Three Drives Down PATTERNThe Three Drives / Three Dives Down pattern is usually short term bearish , but near term and long term bullish .
Previously, we saw a -32% correction. This time, it could be a little higher if we consider the previous neckline support:
The only way I see this paying out differently, is if the price captures the current resistance zone, and CLOSES above it:
__________________
NASDAQ:AAPL

AAPL LOOKING BULLISH 14TH MAY 2025Aapl is looking good to go long at current price as every demand is being respected and price is looking to go deeper into tbe supply zone.
So I will be going long with STOCKS ONLY.
If you any doubts do let me know in the comments below

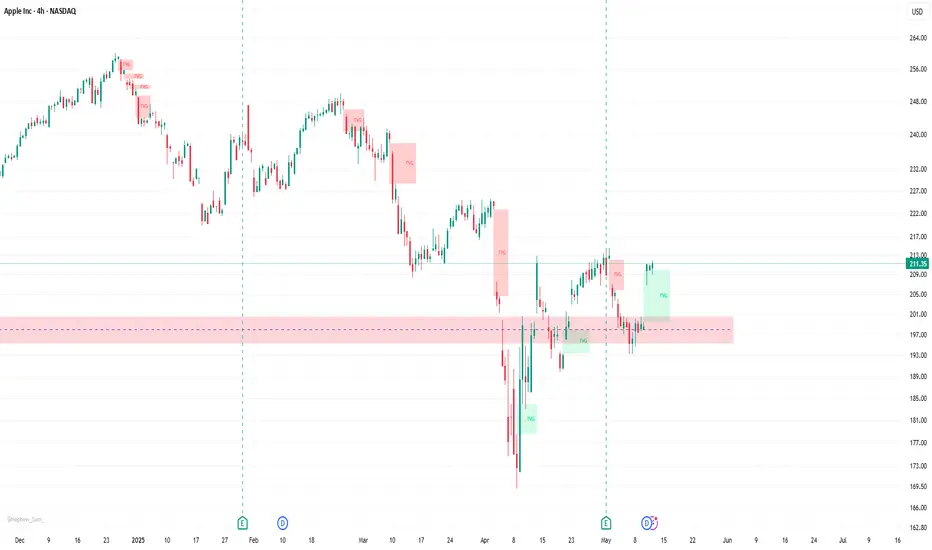
Apple Inc (AAPL) 4-hour chart Trade IdeaSmart Money Concepts (SMC) — especially demand zones, Fair Value Gaps (FVG), and market structure.
📊 1. Market Structure
The chart shows a shift toward bullish structure after a significant downtrend earlier.
Price formed a higher low inside a strong demand zone (highlighted in pink), suggesting potential trend reversal.
The recent bullish impulse suggests a possible break of structure (BOS) or change of character (CHoCH).
🟩 2. Demand Zone
A major demand zone is highlighted in pink (around $197–$201).
Price reacted strongly from this zone, where multiple buy orders were triggered:
Buy 100 @ 211.36
Buy 100 @ 211.35
Buy 100 @ 211.30
Buy 100 @ 211.32
This zone likely represents institutional interest or an area of accumulation by smart money.
📐 3. Fair Value Gaps (FVG)
Several FVGs (imbalances) are marked on the chart:
Bearish FVGs formed during previous sell-offs (marked in red).
A recent bullish FVG (marked in green) has just formed and partially filled, indicating momentum continuation.
These gaps act as potential support/resistance levels and often attract price action to rebalance inefficiencies.
🎯 4. Targets & Risk Management
Take-Profit (TP) target: $249.07
This level is a previous high and likely premium zone based on SMC theory — where smart money exits.
Stop-Loss (SL): $192.98
Below the demand zone — reasonable invalidation point if price breaks structure and goes lower.
⚖️ 5. Risk-to-Reward Ratio (RRR)
Entry around $211.30 – $211.36
SL around $192.98 → ~18 points risk
TP at $249.07 → ~38 points reward
Risk-to-Reward ≈ 2.1:1 → This is a favorable RRR setup.
🔍 Conclusion
Current Bias: Bullish
Entry Justification: Strong reaction from demand zone + buy orders aligned with FVG
Outlook: Price may aim to fill higher imbalance and reach the premium target zone (~$249), as long as it holds above the demand zone
Invalidation: A break below $192.98 would invalidate the bullish setup
AAPL Wait for Break Out Fibo LevelSignal for AAPL NASDAQ:AAPL
Direction: Buy 🟢
Entry Price: $214.41 (Wait For Fibonacci breakout level as shown in the chart) ✋
Profit Target: $236.90 (targeting the upper resistance level indicated in the chart) 🤑
Stop Loss: $198.75 (below the recent consolidation low for a 2:1 risk-reward ratio)
Risk-Reward Ratio: 2:1
Position Size: Risk 1-2% of your portfolio (e.g., for a $100,000 portfolio, risk $1,000-$2,000)
Entry Timing : Enter on breakout confirmation above $214.41 (Fibonacci level), ideally at the next 4H candle close after the break
Confidence Level: 70%
Why This Signal?
Price Action: AAPL is approaching a key Fibonacci level at $214.41 after consolidating between $203.75 and $214.41. A break above this level signals bullish momentum toward $236.90.
Technical Indicators:
Breakout above the 50-day and 200-day moving averages.
News Sentiment: Mixed with US-China trade tensions (per Forex Factory), but AAPL’s fundamentals remain strong with recent positive sentiment on X.
Follow for the best AI Generated Signals based on Latest Models.
Ash

AAPL OversoldLooks like AAPL is oversold and the price is ready to break out above, in the short term.

An AAPL (quick) turnover trade - long at 196.25There's nothing particularly pretty about AAPL's 2025 chart. It's in a solid downtrend since the start of the year, losing 24%+ this year. However, a recent higher high and higher low since the April 8th low, and support from the April 21 pullback low close by gives me a little hope that a quick snapback is potentially in store. Potentially grabbing the upcoming dividend is just a bonus. 4 down days is typically a good contrarian indicator as well, though its run of 8 consecutive up days just prior to this tell me there may be more room to run lower.
But AAPL is AAPL and when someone comes up with a legit challenger to them, I'll worry about this trade. Until then, I'll yawn, be patient, and collect my profit eventually. If that's in 2 days, great. If it's in 2 months, not as great but I have literally never had AAPL not pay me and I don't expect this time will be any different.
As always - this is intended as "edutainment" and my perspective on what I am or would be doing, not a recommendation for you to buy or sell. Act accordingly and invest at your own risk. DYOR and only make investments that make good financial sense for you in your current situation.

AAPL BULLISH IDEAApple stock looking very bullish on multiple timeframes, nice head and shoulder on weekly in combinations with liquidity grabs and a precise entry on daily and H4 suggests this thing wants to go higher, good trade with 1:10 RR

AAPL is currently in a sideway-bearish phase—no bullish breakout
📉 Daily Chart – No Confirmed Bull Trend Yet
On the daily chart, AAPL has not established a clear bullish trend.
Price remains below the Confirmation Trigger at 199, which means the bull structure is not validated yet.
Both AO and RSI are showing sideway movement, with no strong momentum to the upside.
🕓 4H Chart – Fails to Break Order Block
On the 4-hour chart, AAPL has made multiple attempts but failed to break through the order block resistance.
Current price structure indicates a bearish-sideway trend—selling pressure is present but not aggressive enough for a full breakdown.
🕒 15-Minute Chart – Bear Trend Clearly Forming
On the 15-minute timeframe, a clear bear trend is emerging:
AO shows a distribution phase.
RSI is below the midline, confirming seller dominance in the short term.
⚠️ Key Levels to Watch:
🔻 Major Support: 182
🔺 Strong Resistance: 199
✅ If AAPL holds above 182, this area could act as a foundation for a new upward leg in the daily trend.
❌ If price breaks below 182, AAPL may officially enter a full bearish trend on the daily timeframe.
✅ Summary (Updated):
AAPL is currently in a sideway-bearish phase—no bullish breakout confirmed.
The 182 level is critical:
Holding above keeps bullish potential alive.
Breaking below confirms a full bear trend on the daily timeframe.
📌 If price consolidates above 182, AAPL may be forming a new support base, potentially building at least two legs before attempting a bullish structure reset.
➤ Strategy: Stay cautious—only consider long positions after a confirmed breakout above 199 or evidence of solid support holding above 182.

AAPL – Long Trade Setup (Support-Based Reversal Opportunity)Apple (AAPL) is pulling back toward a key support zone between $197–$198, aligning with both previous structural support and potential demand zone behavior. This setup offers a favorable risk-to-reward profile for a swing long entry.
🔹 Entry Zone:
$197 – $198
🎯 Take Profit Targets:
🥇 $210 – $215
🥈 $225 – $233
🛑 Stop Loss:
Just below $190

Apple 24hr potterboxI know apple is going to make all of that up and be a number one stock again. why wouldnt it be. The stock market goes up just not in a straight line. I use dollar cost method which you by every month or week with the same amount every month and just keep buying. It has worked very well for me , instead watchin this screen everyday I have set my acconts to buy every month . I do not use discord because of two many grown men acting like children. Its all fun and games until you miss a trade because someone wants to be funny. Happy trading.
APPLE SQUEEZE RIP PLAYI think apple is tapping in to a highly probable reversal area and could be setting up for a clean bullish run to end the week

“Shaky Support: AAPL’s Bearish Setup Unfolding” 1. Sharp Decline and Recovery (Late March to Early May)
There was a significant drop in price followed by a strong rebound, but that rebound stalled just under previous resistance levels (around late April), forming a short-term lower high.
2. Current Structure Looks Weak:
Price is now consolidating sideways with a slight downward drift after rejecting the $207–$210 area. This could be interpreted as a bearish flag/pennant breakdown after the failed rally.
3. Volume Spikes on Drops:
Noticeable volume increases on the selloffs — especially during the big dip — which hints at distribution rather than accumulation.
4. Short-Term Trend:
The current short-term trend is downward. The price is making lower highs and lower lows after the bounce, indicating possible continuation to the downside unless new buying pressure steps in.
AAPL Bearish Continuation Strategy (Short-Term Swing)
Bias: Bearish (based on lower highs, breakdown after failed rally, and weak consolidation)
ENTRY:
• Trigger: Enter put options or a short position if price breaks below the recent consolidation low (around $196–$197).
• Confirmation: Look for increased volume and a clean close below the $196 level on the 1h chart.
TARGETS:
1. First Target: $188 – minor support zone from early May.
2. Second Target: $180 – psychological and historical support area.
STOP LOSS:
• Placement: Tight stop just above the recent consolidation high — around $202.50–$203.
• Keeps risk controlled and invalidates breakdown setup.
OPTION STRATEGY (if using options):
• Put Option: 2–4 weeks out, ITM or slightly OTM strike ($200 or $195 puts).
• Spread Alternative: Bear Put Spread ($200/$190) to lower cost and define risk.
Why This Works:
• Price has rejected previous resistance near $207.
• Structure is showing a bear flag/pennant failure.
• Volume confirms sellers are active on the drops.

World's number 1 brand - AppleApple's iPhone 15 was the best-selling smartphone globally in 2024, according to Counterpoint Research's Global Handset Model Sales Tracker. Apple and Samsung continued to dominate the top 10 best-selling smartphones list, with no other brands making the list for the third consecutive year!
It has a very powerful stickability once a consumer started using it. From phone to laptop and cloud, it dominates while other brands try to play catch up. WB also mentioned that Apple shares is the largest holding in the Berkshire's Hathaway holdings, a staggering 60 billion investment. Mind you, he did not buy Apple during the IPO days else his returns would be even more !
The share price fell almost 35% from the peak and rebounded quickly when it hit the support level at 169.49. Now, at slightly below 200, I think Mr Market is offering opportunities for us to accumulate/long this company.
Once the tariff issues settled down, this stock will continue to rally. Meanwhile, we are seeing reducing sales in China, Apple moving part of its operation to India , etc. This are smokescreen and once must not let these temporary issues affect the decision in buying this great company.
Think again, if there is no short term negative news such as this, how else would the share price falls 35% for no apparent reasons? And if you are not smart/quick enough to go grab some, well........years down the road, you would see that Mr Market does give second chances to all - you just have to be alert to take a calculated risks and a longer time horizon to reap the rewards.
I am vested and thus my views are biased. You are free to disagree and as usual, please DYODD.

Apple Shares (AAPL) Drop Below $200Apple Shares (AAPL) Drop Below $200
Late last week, Apple released a quarterly report that beat analysts’ expectations:
→ Earnings per share: actual = $1.65, forecast = $1.63
→ Revenue: actual = $95.36bn, forecast = $94.5bn
However, today AAPL stock price is below the psychological $200 mark, over 7% lower than last week’s high (point E).
Why did AAPL shares fall?
According to media reports, investors were concerned about weaker-than-expected services revenue and disappointing sales in China. These factors have renewed fears that the ongoing US–China trade tensions could have a deeper impact on Apple going forward.
Bearish sentiment may also have been amplified by Warren Buffett’s decision to step down as head of Berkshire Hathaway — as we noted yesterday — since his company is one of Apple’s major shareholders.
Technical Analysis of Apple Shares (AAPL)
Key AAPL price action patterns (marked) show a sequence of lower highs and lows, forming the basis for a downward channel. Fibonacci ratios reinforce bearish characteristics in price movements:
→ The rise from B to C is approximately 50% of the decline from A to B
→ The rise from D to E is around 50% of the decline from A to D
This technical picture suggests a potential bear market, where rallies may be corrective rebounds following impulsive drops. This strengthens the scenario in which AAPL shares could continue falling within the established descending channel.
This article represents the opinion of the Companies operating under the FXOpen brand only. It is not to be construed as an offer, solicitation, or recommendation with respect to products and services provided by the Companies operating under the FXOpen brand, nor is it to be considered financial advice.

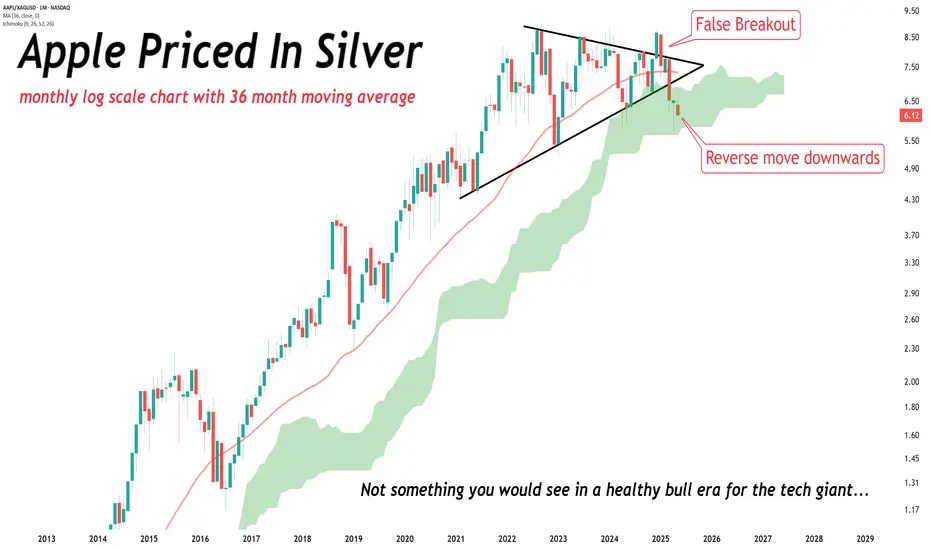
Who else caught this ominous looking chart?Who else caught this ominous looking chart?
Tech giant Apple (priced in silver) is breaking down after a failed move upwards.
Warning signs appearing left and right...