APPLE Set To Grow! BUY!
My dear friends,
Please, find my technical outlook for APPLE below:
The price is coiling around a solid key level - 205.25
Bias - Bullish
Technical Indicators: Pivot Points High anticipates a potential price reversal.
Super trend shows a clear buy, giving a perfect indicators' convergence.
Goal - 208.36
About Used Indicators:
The pivot point itself is simply the average of the high, low and closing prices from the previous trading day.
Disclosure: I am part of Trade Nation's Influencer program and receive a monthly fee for using their TradingView charts in my analysis.
———————————
WISH YOU ALL LUCK
AAPL34 trade ideas

APPL - Another pattern associated with 69I have many ideas where I talk about 69\96 indicating local and global price reversals. Here we were additionally shown 99, which means strong growth. I'm going to fixate on the imbalance overlap. See attached ideas

APPLE: Bullish Continuation is Expected! Here is Why
Our strategy, polished by years of trial and error has helped us identify what seems to be a great trading opportunity and we are here to share it with you as the time is ripe for us to buy APPLE.
Disclosure: I am part of Trade Nation's Influencer program and receive a monthly fee for using their TradingView charts in my analysis.
❤️ Please, support our work with like & comment! ❤️

Apple to retest 224$ soon!Dear traders. After a bullish week on most of the giants in tech market, Apple lingered! However, based on technicals, after a clear breakout of the trendline and a retest, now the potential of a new upward leg is high. It could retest 224$ as the first target. Let's See!

Apple (AAPL) – A Tariff Storm Ahead📉 Apple (AAPL) – A Tariff Storm Ahead?
🗓️ Timeframes: 4M & 4W
💬 Headline: Reports are surfacing that Apple could take a $900M+ hit this quarter due to new tariff regulations, and the charts already reflect smart money repositioning.
🔍 Technical Breakdown:
📌 4M Chart:
Clear rejection from the $260.10 previous high
Fresh bearish momentum candle forming with downside momentum
$205.35 acting as a weak support before clean air to $169.21
📌 4W Chart:
Market structure broken
Bearish continuation underway with a projected liquidity target near the $170–$125 zone
Watch for a potential retracement to the $217–$225 supply block before continuation
⚠️ Macro Meets Market:
With Apple now in the tariff crosshairs, fundamentals are aligning with technicals. If this bearish pressure plays out, the current price might just be the ceiling before the markdown.
📍Key Levels to Watch:
$217–$225: Potential short setup zone
$205: Break below confirms continuation
$169: Historical key demand zone
$125: Macro retest from pandemic breakout
🎯 Final Thought:
The market always moves before the media catches on. Now that headlines are surfacing, the charts were already screaming weakness. This isn’t just pullback—it’s a realignment.

AAPL Pre-Earnings Put
Market Analysis
Looking at Apple NASDAQ:AAPL ahead of today's earnings announcement, I've identified a compelling pre-earnings put opportunity. NASDAQ:AAPL has shown mixed momentum recently with the stock trading near $211 after experiencing a 5.21% increase last week, bringing its market cap to approximately $3.19 trillion.
Instrument Details:
NASDAQ:AAPL May 2, 2025 $200 PUT
Entry: $0.74
Target: $1.48 (100% gain)
Stop-Loss: $0.37 (50% risk)
Position Size: 1 contract
Entry Timing: Pre-earnings close (Today)
Technical Rationale & Market Context
Recent market sentiment data indicates Apple has a news sentiment score of 0.66, which is lower than the Computer and Technology sector average of 0.77. Short interest has increased by 0.71%, suggesting declining investor sentiment. Joby Aviation This divergence between price action and sentiment creates our setup opportunity.
Apple faces heightened volatility expectations with the options market showing speculative interest between the $200-$220 range. Tonight's earnings report is critical as investors seek clarity on how Apple plans to navigate the ongoing US-China trade tensions and recent App Store legal challenges.
Risk/Reward Analysis
With the expected post-earnings move of 6%, our position has a favorable risk/reward profile:
Maximum profit: 100% ($0.74 to $1.48)
Maximum loss: 50% ($0.74 to $0.37)
Confidence level: 65%
Breakeven: AAPL needs to drop below $199.26 by expiration
Catalysts & Exit Strategy
The main catalyst is tonight's earnings report after market close. I expect the current valuation may face challenges if:
Revenue guidance disappoints
iPhone sales show weakness in key markets
Services growth fails to meet expectations
Stocks are not gambling, everyone can make money, so can you
Follow for best in class LLM models
AAPL SHORT Waiting for NASDAQ:AAPL to reach the high 208 level to short as it has broke a 1 HR multipal touch trend line and broke below a key support and resistance.

Long winded idea about AAPL being a GO for the upside.I walk through updating my trendlines and support/resistance lines to show you how I refresh my charts.
AAPL caught my attention because it is down in pre-market. This may create an opportunity to get in at a better price. It's stabilized from the February downtrend, holding above the 10&20 EMAs.
This gap down can hold around 206 where it's at now, or can fall further. If it falls further, wait for it to stabilize again or look for a strong pivot.
I think the higher probability is: it will dance around that 206 and EMA and do a shorter (intraday -3 day) reset to go higher.
If/when AAPL is a go to the upside again, look out for these potential pause or pullback points:
212-214 recent consolidation area
216 declining 50sma
226 recent previous resistance and 200SMA
237 break of weekly downtrend line and end of last year resistance levels
250 pivot high at the end of February
259 ATH

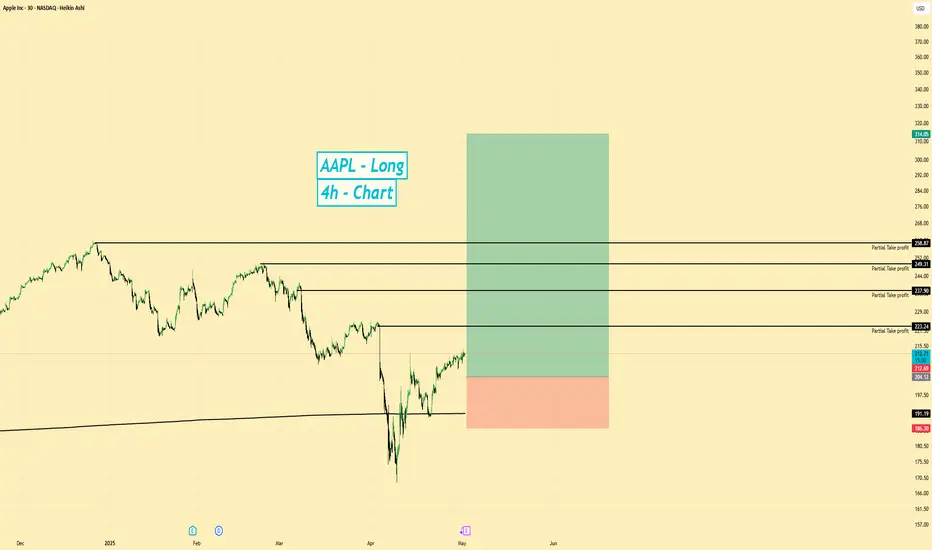
AAPL | Long Setup | Near Resistance | (May 2025)AAPL | Long Setup | Fundamentals but Near Resistance | (May 2025)
1️⃣ Insight Summary
Apple is showing strength, recently gaining over 24% from the lows. While it’s currently facing resistance, it sits on solid support around the volume-weighted average price (VWAP). Earnings are expected today and could drive short-term volatility.
2️⃣ Trade Parameters
Bias: Long
Entry Zone: Around $200
Stop Loss: $186
TP1: $223
TP2: $237
TP3: $249
TP4: $258
Partial Exits: Planning to take 80% profit by TP4 and let the rest run if momentum continues.
3️⃣ Key Notes
💰 Apple’s fundamentals remain strong:
• Revenue: ~$400B
• Net Income: ~$93B
• Free Cash Flow: ~$108B
• Debt: ~$120B
• Assets (tangible): ~$27B
📊 Based on tangible book value, AAPL appears overvalued, but it still holds up well fundamentally.
📉 Beta is 0.7 (slightly less volatile than the market), while the earnings push shows around 1.6 expected growth.
⚠️ Given the valuation and current resistance zone, I’ll be taking a more cautious position. Apple is not my top pick but remains in my top 20 watchlist for this cycle.
4️⃣ Follow-up Note
I’ll be monitoring closely around the $200 level and post an update after earnings or if the price action gives a clear signal.
Please LIKE 👍, FOLLOW ✅, SHARE 🙌 and COMMENT ✍ if you enjoy this idea! Also share your ideas and charts in the comments section below! This is the best way to keep it relevant, support us, keep the content here free and allow the idea to reach as many people as possible.
Disclaimer: This is not financial advice. Always conduct your own research. This content may include enhancements made using AI.
APPL ORDER BLOCK $222APPL heading straight to $222 in order to retest the order block. Be aware of reports on 2 days that will determine if price stays there or goes down again.

Trading Analysis for Apple**Current Price:** $208.37
**Direction:** **LONG**
**LONG Targets:**
- **T1 = $213.50**
- **T2 = $216.80**
**Stop Levels:**
- **S1 = $206.10**
- **S2 = $202.85**
---
**Wisdom of Professional Traders:**
This analysis synthesizes insights from thousands of professional traders and market experts, leveraging collective intelligence to identify high-probability trade setups. The wisdom of crowds principle suggests that aggregated market perspectives from experienced professionals often outperform individual forecasts, reducing cognitive biases and highlighting consensus opportunities in Apple.
**Key Insights:**
Apple is showing short-term bullish momentum supported by favorable technical indicators, including a rising RSI, MACD convergence, and strong stochastic oscillator trends. Sector-wide optimism in the technology space has further buoyed the stock’s performance, creating opportunities for upside gains. Key resistance levels will be pivotal in determining the stock's trajectory, especially as Apple approaches its earnings release. In the longer term, challenges remain, with persistent selling pressure keeping the price below critical moving averages.
**Recent Performance:**
Apple's price recently rebounded off its lows, supported by both sector-wide recovery and anticipation for its upcoming earnings. Despite the positive trends, the stock has been constrained by resistance near $212-$213, which has historically capped price breaks during periods of volatility. On the downside, support levels near $208 have held firm, signaling a consolidation phase that could precede a breakout if market conditions align favorably.
**Expert Analysis:**
Market analysts are closely watching Apple ahead of its pivotal earnings announcement, which could serve as a defining moment for the stock's short-term trajectory. Positive earnings results, highlighting growth in earnings per share (EPS) and revenue, are expected to drive Apple toward higher targets. However, analysts caution that macroeconomic uncertainties and valuation risks should remain on traders’ radars. From a technical analysis perspective, a breach of the $213 resistance level paired with increased bullish sentiment in the sector could act as catalysts for further upward moves.
**News Impact:**
Apple's anticipated earnings release is expected to showcase moderate positive growth (+5.2% YoY in EPS, +3.6% YoY in revenue). These results could reset market sentiment and drive enhanced optimism in the stock. Additionally, with key earnings reports from Meta and Microsoft setting the tone earlier in the week, Apple has the potential to confirm or extend this bullish sentiment for the tech sector. Strong earnings and upbeat guidance could help Apple nullify resistance above $213, whereas weaker-than-expected results may amplify downside risks and lead to a reevaluation of its support levels.
---
**Trading Recommendation:**
Based on aggregated insights and recent momentum indicators, Apple represents a solid LONG opportunity for traders. The stock is positioned to benefit from favorable sector trends and upcoming earnings, with potential upside targets set at $213.50 and $216.80. Traders should consider the stop levels at $206.10 and $202.85 for risk management, while keeping an eye on earnings results and broader market developments to adjust strategies accordingly.
```

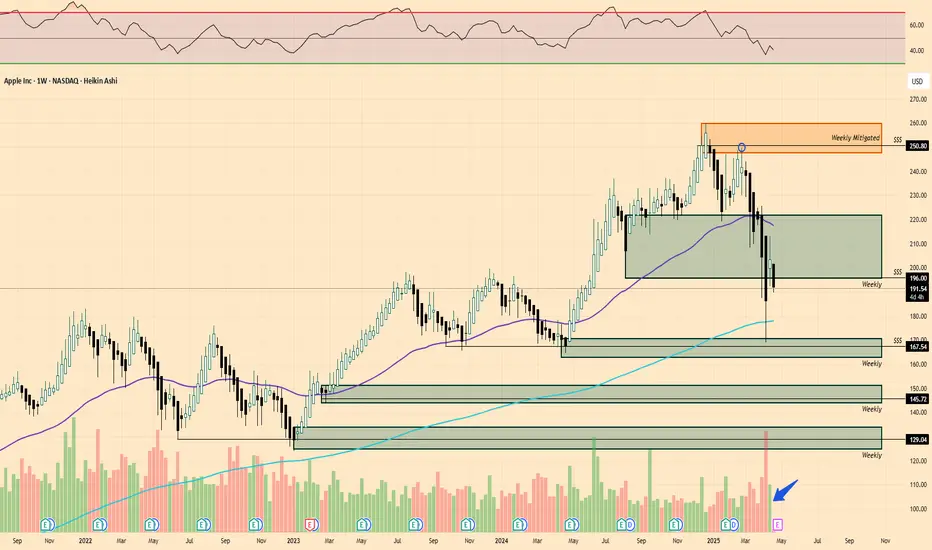
$AAPL doesn't bottom until $143-167Despite a bounce off the lows, NASDAQ:AAPL 's price action is still bearish.
The 4th wave of the correction produced a large bounce, but that wave is coming to an end and now it's time for the final move down to the lows.
I think it's likely that we bottom at the two lower supports at $143 or $151 before the correction is over.
Let's see how it plays out over the coming weeks.

Apple Inc. Stock Price Target Lowered Amid Tariff ConcernsApple Inc. (NASDAQ: AAPL) is trading at $208.37 after climbing 4.32% in the latest session. Despite the recent bounce, analysts have made downward adjustments to its price outlook ahead of the company’s March 2025 quarterly earnings report. UBS analyst David Vogt has revised Apple’s price target from $236 to $210 while maintaining a ‘Neutral’ rating. This adjustment comes in response to anticipated U.S. tariffs and potential pressure on production costs.
UBS reported that Apple expedited about one million iPhone shipments during the quarter. This strategy contributed to a modest increase in iPhone revenue, despite flat demand. With the U.S. dollar weakening against major currencies, UBS also raised its March quarter revenue estimate to $95.5 billion, up from $93.5 billion. EPS forecasts were adjusted accordingly.
On the other hand, MoffettNathanson Research downgraded its price target from $184 to $141 and reiterated a “Sell” rating. The firm highlighted risks related to trade tensions, increasing manufacturing costs due to tariffs, and slowing innovation. According to their analysis, Apple faces difficult choices—either absorb high tariff costs or reconfigure supply chains at a premium. Both options are expected to affect profitability.
Technical Analysis
The stock has rebounded from a key support level near $170, which aligns with a long-term demand zone visible on the 3-day chart. It has broken above the 200-day moving average of $192.82 and now trades slightly below the 100-day moving average of $213.53 and 50-day MA at $229.03.
Momentum indicators suggest a possible continuation. The RSI stands at 45.67, showing recovering strength. If AAPL holds above $200, it may retest the $197 support level before targeting $260.10. A rejection could lead to a retest of the $170 support area.

Apple Rebounds, But Faces Overhead Resistance in Supply ZoneAAPL DAILY TECHNICAL ANALYSIS 📊
OVERALL TREND
📈 UPTREND — Multiple higher lows forming since early April. Bullish sentiment is active, but nearing overhead resistance.
🔴RESISTANCE ZONE
🔴 260.1000 — SELL STOPLOSS | PIVOT HIGH
🔴 255.6074 — SELL ORDER 2
🔴 246.5146 — SELL ORDER 1
🎯ENTRIES & TARGETS
🎯 241.9220 — BUY ORDER & TP 4
🎯 225.3843 — BUY ORDER & TP 3
🎯 214.6555 — BUY ORDER & TP 2 | Mid Pivot
🎯 199.2067 — BUY ORDER | TP 1
🟢SUPPORT ZONE
🟢 183.4116 — BUY ORDER 1
🟢 173.7546 — BUY ORDER 2
🟢 169.0100 — BUY STOPLOSS | PIVOT LOW
🤓STRUCTURAL NOTES
Price bounced sharply off the Pivot Low at 169, reclaiming ground quickly and confirming new bullish structure.
Currently approaching a high-density supply area between 244–260, with multiple sell orders stacked.
SMA and EMA clusters between 198–203 offer strong dynamic support.
MACD and Momentum show bullish crossover, backing the recovery.
Ichimoku Base Line remains neutral, signaling consolidation risk without volume.
📈OSCILLATOR SUMMARY
RSI (60.70) and Stoch %K (75.49) remain Neutral , but hovering near bullish zones.
MACD and Momentum both signal Buy — early signs of bullish energy.
Most other indicators remain neutral, suggesting waiting for confirmation above 214.
📊MOVING AVERAGES OVERVIEW
Strong Buy sentiment on all short and mid-term EMAs & SMAs (10–100 day).
Slight divergence at the 200 EMA/SMA — both still signaling Sell , capping long-term trend bias.
Hull MA is bearish (204.73), indicating some volatility or short-term rejection potential.
TRADE OUTLOOK 🔎
📈 Bullish bias remains above 199.20 — next targets sit at 204 → 214 → 225
📉 Bearish reversal only activates below 199 with strong volume and daily close under 183
⚠️ High-confluence SELL ZONE at 244–260 may halt or reverse price temporarily
🧪STRATEGY RECOMMENDATION
CONSERVATIVE SWING ENTRY (Trend Continuation):
— Buy Entry: 199.20
— TP Levels: 204.00 / 214.65 / 225.38 / 241.92
— SL: Below 183.00
HIGH-RISK SCALP REVERSAL (Inside Sell Zone):
— Sell Orders: 244.00 / 255.60
— TP: 225.38 / 214.65
— SL: Above 260.10
“Discipline | Consistency | PAY-tience”

AAPL eyes on $208.xx: Key Resistance to Tariff Recovery wave AAPL trying to recover through the various tariff news.
Currently testing a key resistance zone at $208.26-208.68
Look for dips, with a must-hold support at $196.65-197.33
.
Previous analysis that called the TOP:
=====================================================

Nebulain: Cantor Fitzgerald Launches $3B Crypto Fund — A New EraThe Largest Crypto Fund of the Year: Cantor, SoftBank, Tether & Bitfinex Join Forces
Cantor Fitzgerald, a major U.S. brokerage firm led by Brendan Latnik, has announced the formation of a $3 billion cryptocurrency investment fund, Cantor Equity Partners, in collaboration with SoftBank, Tether, and Bitfinex.
The fund's goal is to make large-scale investments in Bitcoin, aiming to replicate the playbook of MicroStrategy, which dramatically grew its valuation by pivoting into crypto.
Breakdown of capital contributions:
Tether: $1.5 billion in BTC
SoftBank: $900 million
Bitfinex: $600 million
Convertible bonds offering: $350 million
Private share placement: $200 million
All assets are expected to be consolidated under a new holding company called 21 Capital, with shares priced at $10, implying a Bitcoin valuation of $85,000 per coin.
Market Impact: Bitcoin Surges with Institutional Support
Following the announcement, Bitcoin is trading near $92,000, holding close to its all-time highs. Initiatives like Cantor Equity Partners reinforce institutional confidence in crypto and contribute to a broader acceptance of digital assets in mainstream finance.
Nebulain Analyst Insight
According to Nebulain's analysts, the participation of global financial giants marks a new level of maturity for the crypto space. It also signals a potential shift in asset allocation strategy for traditional investors.
“We're seeing more than just speculative enthusiasm. These moves are backed by structured capital, long-term outlooks, and a readiness to treat Bitcoin as a reserve-grade asset,” Nebulain stated.
However, the firm also points to ongoing regulatory uncertainty and inherent market volatility as key risk factors to monitor.
Conclusion
The launch of Cantor Equity Partners represents a milestone in the institutionalization of crypto. With heavyweights like SoftBank and Tether at the table, the industry is entering a new phase where digital assets are no longer niche — they are a strategic allocation.
This article was prepared by Nebulain Analytics for informational purposes only. It does not constitute investment advice.
BINANCE:BTCUSDT

AAPL Eyes 212+ After Strong Momentum Breakout! Key Gamma Levels in Focus 🚀
GEX (Options Sentiment) Insight
AAPL has surged toward a key gamma resistance zone. The GEX map shows the Gamma Wall at $210, with a possible stretch target to $212. This level has the highest positive NET GEX, making it a strong magnet if bulls continue pressing. IVR is moderate at 51.8, while the options flow shows bullish bias with 3 green dots and only 21.7% in PUT pressure, giving calls the edge short term.
Suggested Options Trade (Short-Term Swing)
Setup: Bullish continuation
Calls: 205c or 210c for 04/25 expiration
Risk Zone: Below $198
Target Zones:
1. 210 (Gamma Wall)
2. 212–213 (Extension if momentum holds)
Thoughts: With volume increasing and option flows tilting bullish, this looks like a clear push toward the gamma wall. However, price may need to consolidate if volume dries up. Only invalidation is a sharp reversal below $198 (prior support zone).
Price Action + Co-Pilot Scalping View
From the second chart (SMC-based), we’re in a confirmed bullish trend, with CHoCH and BOS aligning across the 1H chart. The structure is strong, but entry caution is warranted until a pullback or retest forms.
Key Trading Levels & Bias
* Above 201.79 = Bullish continuation
* Break below 198.95 = Trend invalidation
* Targets:
* T1: 212 (RRR 1)
* T2: 219 (RRR 2)
* Stop: Below 198
* Note: Momentum is currently extended—wait for either consolidation or a CHoCH/BOS on lower timeframes to re-enter confidently.
My Take
This move feels like the beginning of a broader trend reversal off deep discount zones. AAPL has lagged behind the recent tech bounce, and this breakout above $200 could invite more call buyers. The risk-reward is solid, but as always—don’t chase highs. Let the setup come to you.
Disclaimer: This analysis is for educational purposes only and does not constitute financial advice. Always do your own research and manage your risk accordingly.

Apple - Wait for the bite!The price looks like a lion in a cage, breaking above or below the wedge will lead to significant changes. For now, sit back and relax, Trump will show the path!

AAPL downside trade to 182?AAPL remains in a clear downtrend on the daily timeframe, with lower highs and lower lows intact. It gapped below yesterday’s low and is trading beneath all daily moving averages. The broader market (SPX) is also showing weakness, supporting the short thesis.
What I See:
Price has failed to reclaim the 10EMA and rejected at prior breakdown zones.
There’s room for a continuation move toward 182, which is a pivot point before it's decline in 2022 and aligns with last years gap up in May.
If momentum continues, AAPL may eventually test the broader uptrend line, which intersects with the area near 175–178, depending on timing. Or back to retest the pivot from earlier this month.
Key Profit Levels:
First target: 182
Remainder: Leave some on to see if it can break lower toward the monthly uptrend support zone
Contextual Note:
While the trend is currently down, this move could still be part of a higher low formation on the daily chart. Even a drop to 182 would be higher than the early April low, meaning buyers could still step in there. So while the trade favors continuation, I’m staying open to the idea that a base or reversal could form instead.
Invalidation:
A sustained move back above 198.70 (recent intraday high + above the open) would invalidate the current short thesis. If it continues down I'll update my stop.
$AAPL | $200 showed lifeThese are my levels I am most concerned with for NASDAQ:AAPL
Last week, $200 level showed life and buyers stepped in but that doesn't mean we are out of the woods and price currently is in semi "no man's land", kind of just hanging around the demand area.
One bright point is bullish price volume last week as well.
I would wait to see how this week turns out before putting money back into the iPhone company.
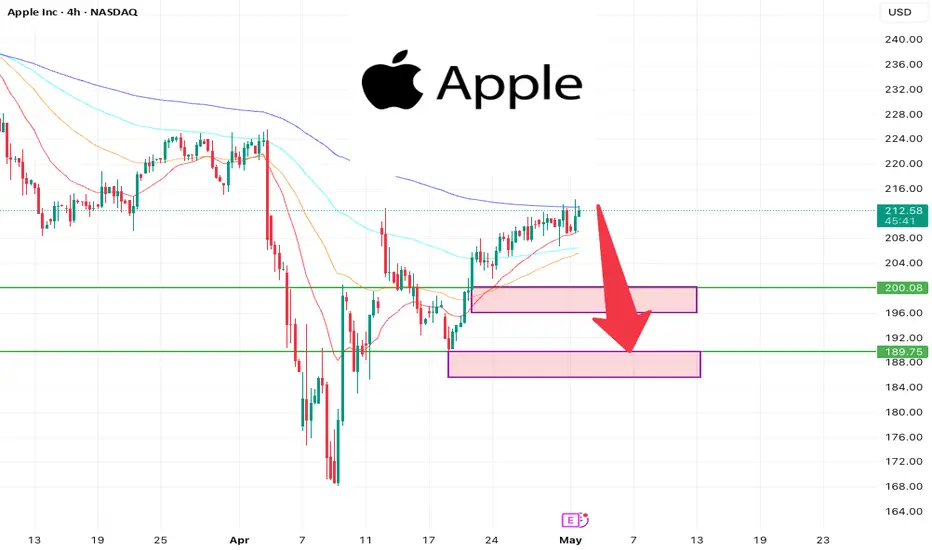
Apple Inc.: A Long Trade Opportunity for Next Week
- Key Insights: Apple has demonstrated relative strength amid broader market
weakness. Buyers have shown interest at key support levels ($193-$190),
reinforcing a bullish setup. Speculative interest in the options market
between $200-$220 indicates potential upside. The stock remains a promising
long trade idea, contingent on breaking resistance above $210-$221.
- Price Targets:
- T1: $210
- T2: $219
- S1: $190
- S2: $185
- Recent Performance: Apple continues to outperform peers like Amazon, Tesla,
and Nvidia as sector-wide weakness persists. The stock has rebounded off
critical support around $193, signaling accumulating buyer interest.
However, it remains capped below resistance at $210-$219, holding potential
for further upside.
- Expert Analysis: Analysts maintain long-term optimism for Apple, citing its
strong fundamentals, operational flexibility, and premium brand positioning.
Technical experts identify Apple as a speculative long idea, with gamma
exposure in the options market signaling interest between $200-$220.
- News Impact: Geopolitical concerns, including U.S.-China trade tensions, weigh
on Apple’s sentiment. Production costs have increased due to tariffs, yet
temporary exemptions highlight Apple's strategic resilience. Analysts advise
monitoring macro trends, including shifts in sector rotation, for continued
price momentum.

Market update on todays Liquidity in the IndexesUpdate on market liquididty going into the week starting 21st April.
Having a look where the price action is hiding in liquidity through the various index tickers.
#SPX #NQ #SP500 #NAS100 #RUT #Russell2000 #AAPL

AAPL Break Test Go!!!I am a macro trader, meaning my trades last a long time.
Up to years unless something changes in the process. As such, I am forced to repost this chart. Here is my initial post on AAPL back on April 3rd, 2025.
This is a classic break, test, go, setup.
WARNING! To all bulls!
