AMZN Near Critical Pivot AMZN Near Critical Pivot – Option Traders, Watch These GEX Levels Carefully!
🧠 GEX Analysis for Options Trading:
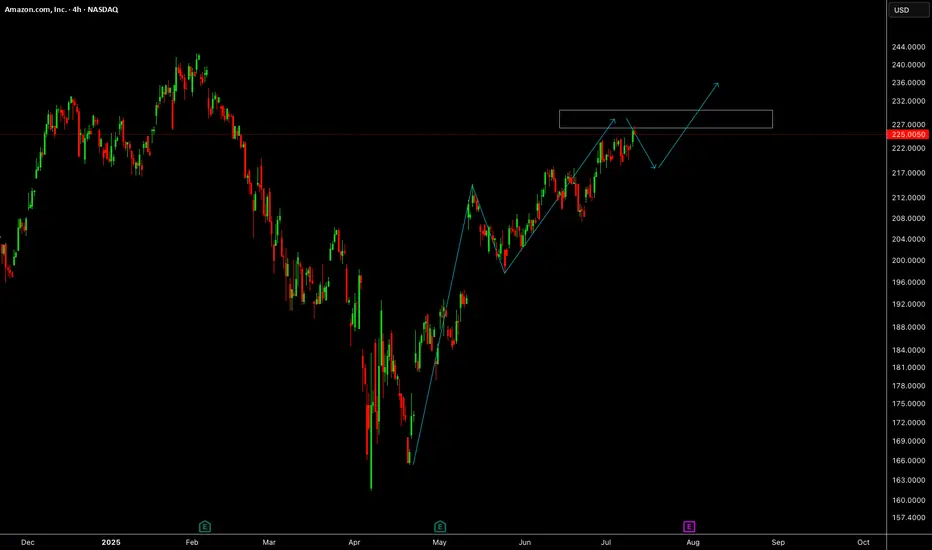
Amazon is sitting right below its Gamma Wall at $225, which aligns with the highest positive NETGEX, suggesting a significant resistance zone. There's a clear call wall stack at $227.5 a
Key facts today
36,964.71
0.00 BRL
319.40 B BRL
3.44 T BRL
212.33 B
About Amazon.com
Sector
Industry
CEO
Andrew R. Jassy
Website
Headquarters
Seattle
Founded
1994
ISIN
BRAMZOBDR002
FIGI
BBG001XT6PL2
Amazon.com, Inc. is a multinational technology company, which engages in the provision of online retail shopping services. It operates through the following segments: North America, International, and Amazon Web Services (AWS). The North America segment offers retail sale of consumer products, including from sellers, advertising, and subscriptions services through North America-focused online and physical stores. The International segment focuses on retail sale of consumer products, including from sellers, advertising, and subscription services through internationally-focused online stores. The AWS segment is composed of global sales of compute, storage, database, and other services for start-ups, enterprises, government agencies, and academic institutions. The company was founded by Jeffrey P. Bezos in July 1994 and is headquartered in Seattle, WA.
Related stocks

AMZN Sitting on a Key Launchpad – What’s Next? for July 14🧠 GEX Analysis & Option Strategy:
* Gamma Wall / Resistance: $225
* Next Major Call Walls: $227.5 → $230 → $235
* Call Side Dominance: 13.3% Calls, low IVR at 27.4, IVx avg 38.9
* Put Support: $217.5 / $213.5
* GEX Bias: Mildly bullish bias above $225 — price is floating at Gamma Wall.
🟢 Bullish Opt

Amazon I Strong Bullish Outlook Welcome back! Let me know your thoughts in the comments!
** Amazon Analysis - Listen to video!
We recommend that you keep this pair on your watchlist and enter when the entry criteria of your strategy is met.
Please support this idea with a LIKE and COMMENT if you find it useful and Click "Follow

AMAZON STRONG UPTREND|LONG|
✅AMAZON is going up
Now and the stock made a bullish
Breakout of the key horizontal
Level of 220$ and the breakout
Is confirmed so we are bullish
Biased and we will be expecting
A further bullish move up
LONG🚀
✅Like and subscribe to never miss a new idea!✅
Disclosure: I am part of Trade Nat

AMZN Coiled at Key Gamma Level! Trade Setup Inside📊 GEX (Options Sentiment) Analysis – AMZN
* Current Price: $223.20
* Gamma Wall (Call Resistance): $225 – Highest Net GEX, significant resistance zone.
* CALL Walls: Stack from $225 → $230 → $232.5 → $235
→ Suggests upside resistance builds fast; option sellers may try to cap the rally here.
* PUT W

AmazonAmazon needs small correction and further push up towards 235 level.
Disclosure: We are part of Trade Nation's Influencer program and receive a monthly fee for using their TradingView charts in our analysis.
AMZN at a Crossroad! TA for July 16Options & Intraday Trading Setups to Watch This Week 🔍
🧠 GEX Analysis & Options Sentiment (Tanuki)
* GEX Sentiment: Mildly Bullish
* CALLs Volume: 10.6% → Neutral-to-Weak Bullish
* IV Rank (IVR): 26.3 → Low implied volatility rank
* IVx Avg: 33.9 → Neutral options environment
Gamma Walls / Levels t

AMZN Gamma Setups + Trade Plan for July 7📡 GEX-Based Option Trading Analysis
Amazon (AMZN) shows bullish option flow into next week. The GEX map highlights the following:
* Highest Net GEX sits at 225, acting as a strong magnetic price level / resistance zone.
* There’s a Call Wall cluster at 225–230, which could cap short-term upside unle

APPLE: 1st 1D Golden Cross in 2 years just formed.Apple is bullish on its 1D technical outlook (RSI = 67.490, MACD = 1.760, ADX = 17.850) and yesterday it started forming the first 1D Golden Cross in more than 2 years. This signals the extension of the 2nd major bullish wave of the 3 year Channel Up. The previous one made an incredible extensino to

AMAZON Will Keep Growing! Buy!
Hello,Traders!
AMAZON is trading in an
Uptrend and the stock made
A breakout and retest of the
Key horizontal support
Of 218$ and is going up again
So we are bullish biased
And we will be expecting
A further bullish move up
Buy!
Comment and subscribe to help us grow!
Check out other forecasts b

See all ideas
Summarizing what the indicators are suggesting.
Oscillators
Neutral
SellBuy
Strong sellStrong buy
Strong sellSellNeutralBuyStrong buy
Oscillators
Neutral
SellBuy
Strong sellStrong buy
Strong sellSellNeutralBuyStrong buy
Summary
Neutral
SellBuy
Strong sellStrong buy
Strong sellSellNeutralBuyStrong buy
Summary
Neutral
SellBuy
Strong sellStrong buy
Strong sellSellNeutralBuyStrong buy
Summary
Neutral
SellBuy
Strong sellStrong buy
Strong sellSellNeutralBuyStrong buy
Moving Averages
Neutral
SellBuy
Strong sellStrong buy
Strong sellSellNeutralBuyStrong buy
Moving Averages
Neutral
SellBuy
Strong sellStrong buy
Strong sellSellNeutralBuyStrong buy
Displays a symbol's price movements over previous years to identify recurring trends.
Curated watchlists where AMZO34 is featured.


