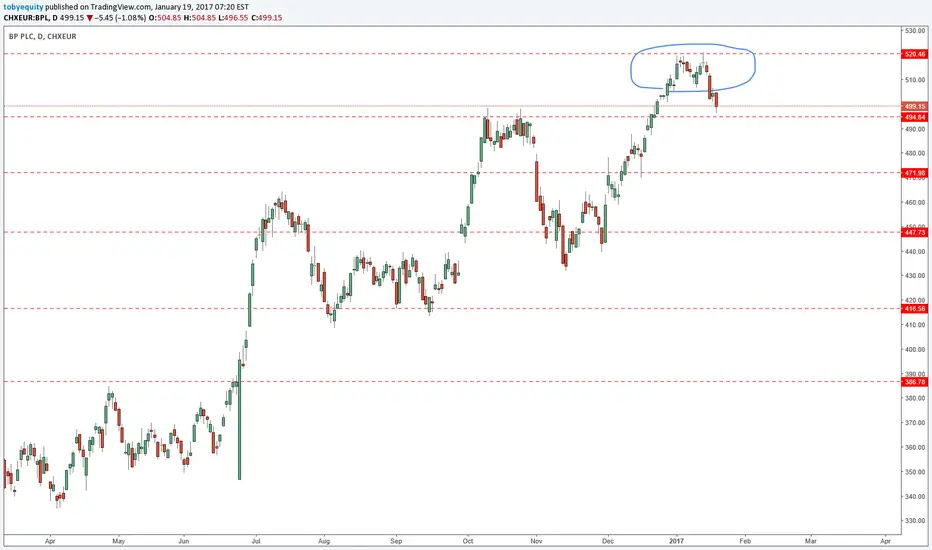
Can BP break its long standing resistance?After today's positive results, can BP break its long standing resistance at 518p?
A resistance that's been in pace since 2011.
It looks like this is the time.
Wait and see.
B1PP34 trade ideas

New Yearly High?BP has broken out of a flag pattern.However, is going negative in the coppock curve. Also, the total revenue has been the same for a while now. Im going to be relying on volatility. If its short it will be only short-termly i believe and if it is Long then short-term increase followed by pull-back then increase until Q4. Also, the moving average is providing support. I put my Long on the next fibonacci level.I have put the Long and short take profit at 1% but I think the price change will be much bigger so if it is - I will extend take profit.

#BP $BP British Petroleum SHORT - BP LEFT / OIL RIGHTShorting BP here as OIL moves to weekly chart resistance trend. Counting cycle complete on short term BP chart too.
5 point stop loss, target is first FIB level.

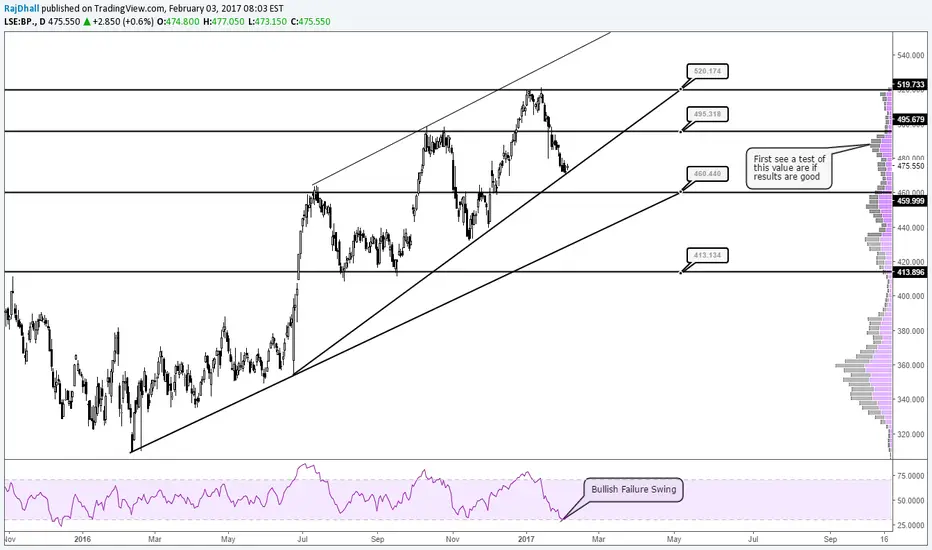
Looking for a move back into valueI believe we could see a move back into value or even higher if the oil price rises after the 22nd Sept OPEC meeting.
We are currently seeing bullish signs and volume is in favor of this move.
I have highlighted what I believe is a floor and ceiling level of the current consolidation level.
The first target would be at the price label and then the top of the consolidation area

strong buy on Major oilBritish Petroleum. very trendy. the 30 minute chart very bullish today and cyclical. dividend seems secure. i can see BP testing 36 again. great for a buy here.

Share price in consolidation after lack of clarity on oil priceI think the share will break out either way once we see the extend of commitment from the OPEC nations and the damage from the Texas hurricane.

BP is just about fully developed for an Initiative RallyIt's tough to buy the mode on a breakout, and better to buy the bottom of the value area of course.
However, BP looks like it's fully developed and may seek higher prices into the previous VPOC from the 2014 decline.
The Initiative rally move hasn't started yet, but measuring from the current rally VPOC, it looks to be just about a perfect 200% symmetrical distribution.

High yeld Dividend stockThis stock pays juicy dividends evry year. No apporaching an intersting support area.
Looking for addiding to my position

BP Potential Buy Point AheadBP has been forming a saucer like pattern and has a potential buy point of 38.78
NYSE:BP

No BE on full BP investmentAs advised early this year on twitter and Facebook... now strategy plays out!
Stay tight if invested as summer will bring the planned capital gains as well as a nice and juicy dividend!

BP - Looks heavy, today's spike could be bull trapRising trend line has been breached, we also see -
Head and Shoulders (H&S)
Bear Flag
H&S neckline and Bear flag floor coincide... offer support at 448.00 levels.
The bearish breakdown was confirmed on Friday. Today's up move is nothing more than a bull trap...
Prices likely to test 400.00 levels over the next week or so.
The bearish view goes will with the fact that Brent oil has breached the year long rising trend line as discussed in the previous post.

#Education Tradingview P&F #BP share chart looking for a breakPoint and Figure Charts (PnF) are another example of a chart type that relies solely on price movements and not time intervals during the creation of the chart. In this way, PnF Charts are similar to Renko, Kagi and Line Break Charts. A basic understanding of PnF Charts is that they are comprised of a series of columns made from either X's or O's. X columns represent rising prices, while columns consisting of O's denote falling prices. Point and Figure Charts were originally popular in the early 1900's before the prominence of computer based charting. They were a way for technical analysts to chart large amounts of data in a short period of time. With the rise of computers, PnF Charts fell out of favor for quite a while. However recently, PnF Charts are once again gaining in popularity. Overall, there is a renewed interest in "noise filtering" charts which focus on price movements alone.

BP - Head and shoulder Oil recovery appears to have saved the day for BP. Daily close below the neckline level seen around 445 would mark a LT trend reversal

BP: Consolidation Completed And Heading To New Lows ?Top Count:
Triangle Minor Wave B is completed and prices will break B-D trendline to recent new lows and beyond.
Alternate Count:
An extended correction for Minute Wave e, which could bring BP -0.77% further up to complete Minor Wave B.
Both wave counts will bring BP -0.77% down to new lows.
Detailed D2 Chart:


LONG BPlets see if it makes the same pattern just inverse. IT could drop a bit more. I came in with 50% of planned position.

UK Stock, BP, H1 LongPossible move up after remove last peak. Waiting on retracement and will look profit on the end of gap.

BP - Possible Short Term Gain SetupNYSE:BP
RSI is oversold
MACD bearish signal is weakening
#stocks $BP #markets


BP is a Zig-Zag UpTrend - Would you invest? Guys, I am absolutely thrilled and be doing well with BP. I have the stock, LEAPS, Put-Sells, and soon Call-Sells.
1. What do you guys think about it 'after' the earnings?
2. Do you feel Brexit will have any negative effect in 2017-18?
3. Where do you see the stock ending in any timeframe? Please be specific $ and Time (if you can).
4. How are they doing with their Retail business with each gas station?
5. What if any are the lingering effects of the $2B to $20B lawsuit that is still pending (last I checked).
6. What is the Chart saying to you?
If you can answer some or all of the above, it would be a great discussion.
Thanks.
Kenny