Correction For April Live Cattle Futures? Technical Outlook:
Live Cattle futures have enjoyed a tremendous rally over the last 3 weeks - up nearly $10 since just the beginning of February. But is the rally showing fatigue? Prices are beginning to stall out near the 61.8% retracement of the all-time-highs in October to the lows in late December. Moreover, momentum signatures are slowing - showing considerable bearish divergence on the standard 14-day RSI in conjunction with a declining volume profile. All of these factors are evidence that all of the bulls are already in the market. In other words, long liquidation and profit capture could send the April Live Cattle contract lower pretty rapidly. Outside markets, like the stock indexes, will likely play a factor in how a correction will play out. On Tuesday, we saw live cattle prices gap lower at the open after the major stock indices sold-off amidst a hotter-than-expected CPI number. Further weakness in equities will paint a dreary outlook for beef demand, and add additional price pressure on the live cattle contracts.
Check out CME Group real-time data plans available on TradingView here: www.tradingview.com
Disclaimers:
CME Real-time Market Data help identify trading set-ups and express my market views. If you have futures in your trading portfolio, you can check out on CME Group data plans available that suit your trading needs www.tradingview.com
*Trade ideas cited above are for illustration only, as an integral part of a case study to demonstrate the fundamental concepts in risk management under the market scenarios being discussed. They shall not be construed as investment recommendations or advice. Nor are they used to promote any specific products, or services.
Futures trading involves substantial risk of loss and may not be suitable for all investors. Trading advice is based on information taken from trade and statistical services and other sources Blue Line Futures, LLC believes are reliable. We do not guarantee that such information is accurate or complete and it should not be relied upon as such. Trading advice reflects our good faith judgment at a specific time and is subject to change without notice. There is no guarantee that the advice we give will result in profitable trades. All trading decisions will be made by the account holder. Past performance is not necessarily indicative of future results.
BGI1! trade ideas

LE1! shortMy view... the price will retrace to daily swap zone .
Try find short opportunity there and take profit beyond 168.5

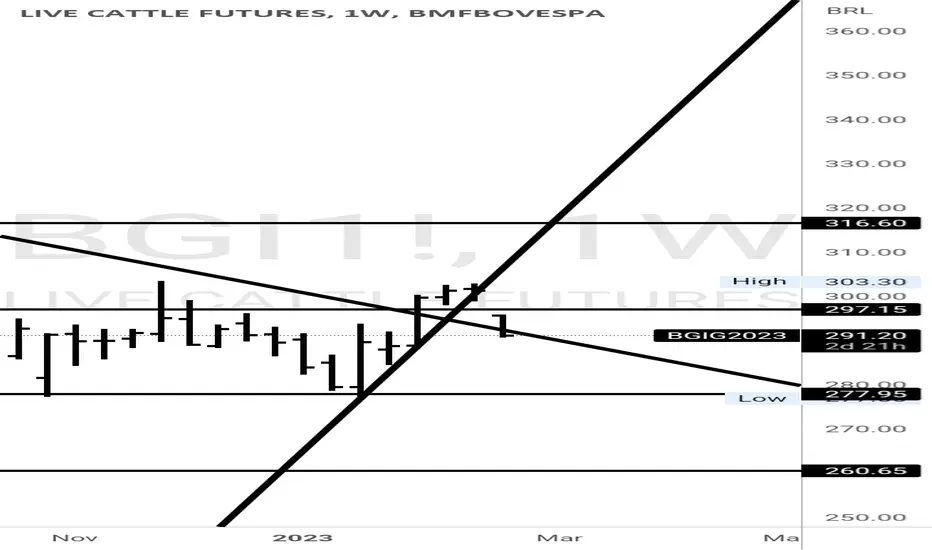
Brazilian Cattle trend upBrazilian cattle has got a long term down trend due to lack of demand but for moment it might change .....trend up now

Could the premium get even beefier?
In a previous article, "A Beefy Premium" , we delved into the growing divergence between Live Cattle and Lean Hogs. Since then, this disparity has only broadened.
Currently, we're seeing a historic peak in both the absolute price difference (Live Cattle – Lean Hog) and the price ratio (Live Cattle/Lean Hog). To comprehend the drivers of this divergence, we need to explore the fundamentals of each sector.
Beef:
USDA economists, Russell Knight and Hannah Taylor, have noted that the repercussions of drought are still impacting calf production. The twin challenges of poor pastures and dwindling hay supplies have made it difficult for farmers to sustain their breeding stock. This has prompted a surge in beef cow culling. With anticipated feed price reductions on the horizon, we predict a tilt towards placing more calves into feedlots in 2024, constricting the cattle supply even further.
Interestingly, despite the tightening cattle supply, demand remains robust. Beef cutout prices reached a pinnacle in October, with prices generally maintaining historic highs on a monthly scale. Seasonally, prices are also expected to rise slightly going into November due to a holiday boost.
A possible explanation for this sustained demand might be the surge in US wages. Empowered with heftier paychecks, consumers are more able to splurge on beef, ensuring packers to keep up their slaughter pace.
Pork:
On the hog front, this quarter reflects a modest uptick in inventory. In contrast to the cattle market, the decline in headcounts here isn’t as pronounced.
A noteworthy correlation emerges between lean hogs and soybean meal. With soybean meal being a staple in animal feed production, its price directly influences producer margins. Factors like the Russia-Ukraine conflict, US droughts, and surging demand for soybean meal have propelled its prices in recent years. Even though the current prices are tapering off, the Soybean Meal/Lean Hogs ratio remains high, signaling shrinking profit margins for producers. Moreover, compared to other commodities, the USDA's support for the Hogs and Pigs market has been relatively scant.
Another point of concern is the prevalence of negative news in the swine industry, such as the European swine industry suffering substantial financial losses in 2023, leading to an 8.5% drop in production. Or bouts of African Swine Fever, threatening global supplies. Such events have the potential to threaten producer’s profitability significantly which could work its way into structural long-term decline in supply. But as of now, this remains to be seen.
Overall:
Current evidence seems to be pointing to a stronger preference for beef given the unwavering demand despite supply shortage and climbing prices. Basic economics principlesnudge producers to markets with higher profitability, which could work its way into an increase in participants leading to supply eventually matching demand. Although this movement, if it happens, does not occur overnight, it will eventually lead to a convergence in prices between the two markets in the future.
There are also other reasons that need not be as drastic that point towards a convergence in prices in the medium term: expectations of Live Cattle supply should improve next year; the road to the maximum willingness to pay for Live Cattle is shorter now.
Hence, to express our continued bearish bias, we could consider a short on the spread of live cattle to lean hogs. Given that both Lean Hog & Live Cattle Futures have the same contract unit of 40,000 pounds and price quotation of US cents per pound, we can trade the spread of the two contracts using a 1:1 ratio. This involves selling one live cattle futures contract at the current price of 185.725 and buying one lean hog futures contract at the current price of 68.025 giving us a spread of 117.7. Each 0.00025 increment is equal to 10$.
The charts above were generated using CME’s Real-Time data available on TradingView. Inspirante Trading Solutions is subscribed to both TradingView Premium and CME Real-time Market Data which allows us to identify trading set-ups in real-time and express our market opinions. If you have futures in your trading portfolio, you can check out on CME Group data plans available that suit your trading needs www.tradingview.com
Disclaimer:
The contents in this Idea are intended for information purpose only and do not constitute investment recommendation or advice. Nor are they used to promote any specific products or services. They serve as an integral part of a case study to demonstrate fundamental concepts in risk management under given market scenarios. A full version of the disclaimer is available in our profile description.
Reference:
usda.library.cornell.edu
usda.library.cornell.edu
beef2live.com
www.cmegroup.com
www.cmegroup.com

Beef Is Looking Toppy...Rising wedge. 60% of these break down. Confluently, the monthly stochastic RSI is topping and the monthly RSI is screaming overbought. I expect a possible and highly probable drawdown of 7-13% over the next 6-9 months. Nothing is for certain, however, so please exercise sound risk management.

Limbo in December Live Cattle December Live Cattle has been in a virtual free-fall since making contract highs back on September 19th. We’ve sold off nearly $7 since scoring the new high. To say it’s been a remarkable year for live cattle futures would be an understatement - we’ve made all time highs, and bucked bearish seasonal tendencies along the way. The strength observed across the cattle contracts is well substantiated by national cash-trade transactions, and cattle on feed numbers - two of the most important components of fundamental analysis in the cattle markets.
Where will we find support?
If you look at the retracement from the contract’s low to the contract’s high, we are quickly approaching the 23.6% retracement level at 183.100. This could be viewed as our first major pocket of support, as it is both a significant fibonacci retracement level, but also a point where we saw prices pace through continuously between July and September.
Trendline Support
In the case that the 23.6% retracement does not hold, another key area to consider is long-held trendline support. Now, that could be a ways away from where we’re at. If price continues to free-fall, trendline support should come into play around 181. But, if prices stabilize and begin moving sideways over the course of the coming weeks, both trendline support and the 23.6% retracement level will converge. This convergence serves a “cluster” of evidence that provides more credibility to the support pocket.
Check out CME Group real-time data plans available on TradingView here: www.tradingview.com
Disclaimers:
CME Real-time Market Data help identify trading set-ups and express my market views. If you have futures in your trading portfolio, you can check out on CME Group data plans available that suit your trading needs www.tradingview.com
*Trade ideas cited above are for illustration only, as an integral part of a case study to demonstrate the fundamental concepts in risk management under the market scenarios being discussed. They shall not be construed as investment recommendations or advice. Nor are they used to promote any specific products, or services.
Futures trading involves substantial risk of loss and may not be suitable for all investors. Trading advice is based on information taken from trade and statistical services and other sources Blue Line Futures, LLC believes are reliable. We do not guarantee that such information is accurate or complete and it should not be relied upon as such. Trading advice reflects our good faith judgment at a specific time and is subject to change without notice. There is no guarantee that the advice we give will result in profitable trades. All trading decisions will be made by the account holder. Past performance is not necessarily indicative of future results.

A third of my whole portfolio is in this short - NFALive Cattle Futures is probably an asset that you have never looked at and never thought to trade.
However, it has been in it's own bull market for the past 3 years !
Having said that, now the chart is showing clear weakness and giving us the perfect entry to the trade with an incredibly low risk and high potential reward. Hitting the first tp would keep it in it's bull run and give it the much needed pullback it needs, hence I feel that it is a great opportunity.
As it is an incredibly bullish asset, I am taking 50% profit at the first tp, then 25% on the 2nd and 25% on the 3rd.

What Disinflation - Beef Price Went Up 64 percent in 5 YearsCME: Live Cattle ( CME:LE1! ), Lean Hog ( CME:HE1! )
Last month, the Bureau of Labor Statistics (BLS) reported that US inflation on food items was 5.7% in June, exactly half of its peak of 11.4% in August 2022. Food inflation is at its lowest level since November 2021.
Under the sub-category “Meats, poultry, fish, and eggs” from Food-at-home, the BLS data shows a negative 0.2%, meaning that meat prices declined in the past year.
The official data contradicts my own experience. Anyone who has been shopping knows that the grocery bill gets bigger every month. Last weekend, I surveyed the Beef section at a local Walmart and found the following:
• Beef cuts with the USDA Choice label price between $12-$18 per pound.
• A primal loin, for example, costs $16.99/lb.
Next to Beef is the Pork section.
• A full slack of spareribs prices at $1.89/lb.
• This is back to the pre-Covid price level.
Why is beef so pricy? Will consumers get some relief as food inflation goes down? In this report, I attempt to find out what drives the beef/cattle price up.
The Cash Cattle Market
According to the National Daily Cattle & Beef Summary published by the USDA, Choice Beef averaged $301.79/cwt (per 100 pounds) nationwide on August 4th. Primal loin cutouts averaged $4.11/lb. This is so much lower than the retail price. But why?
The USDA reports transactions occurred at meatpackers, where cattle farmers sell their beef cows. The report shows the value chain throughout the packing process:
• Live Cattle: Steer (male cow), 187.55/cwt; Heifer (young female), $187.26/cwt;
• Beef Carcass: $284.86 (Choice);
• Primal Flank: $214.84 (Choice);
• Primal Rib: $457.54 (Choice);
• It also lists prices for Chuck, Round, Brisket, Short Plate, Trimmings, etc.
From the packing plant, beef goes through cold storage, wholesale, and retail distribution before consumers pick up their favorite meat at the grocery store.
During the inflationary period, labor and energy become more costly, driving up the cost of each stage of processing and distribution. Higher interest rates also raise the cost of business overhead. These together widen the price spread between live cattle and retail beef cutout significantly.
In the beef cattle value chain, it takes farmers two years to raise the cows, while processing and distribution take maybe two weeks to complete. However, farmers receive only about 20% of the final sales price.
The Cattle Cycle and A Shrinking Herd
Cattle cycle is the process in which the size of the national cattle herd changes over time, from low point to low point. The cattle cycle averages 8–12 years and is influenced by the cattle prices, input costs that drive producer profitability, the gestation period, the time needed for raising calves to market weight, and climate conditions.
If cattle prices and producer profits are expected to rise, producers may expand their herds; if prices are expected to decline, producers will reduce their herds by culling older cows and keeping fewer heifers to replace older cows.
Cow-calf producers’ response to price fluctuations may be delayed because of the lengthy gestation period for cattle relative to hogs and poultry. The total number of beef cattle in the United States is highly dependent on the stage in the cattle cycle.
Last month, the USDA reported that the latest herd inventory for all cows and calves was 95.9 million, down 3% year-over-year. Beef cow inventory was 29.4 million, also down 3%. The decline in beef cow supply is the main driver for higher beef prices.
Over the past 50 years, the US cattle herd has shrunk significantly.
• Inventory for all cows and calves peaked at 132 million in 1975. We have lost over 36 million cows or 27% of all cattle supply.
• Beef cattle inventory peaked at 45.7 million. We now have 2/3 of peak herd size.
A counter argument is that, with technology advancements, we need fewer cows for the same amount of beef supply. The production time gets shorter, and the cows gets bigger. People now have healthier diets and take in less red meat.
According to USDA data, per capita beef consumption was 63.3 pounds in 1960. It declined to 59.1 pounds in 2021, down 6.6%. But look at the huge population growth for people. The US had 203.2 million people according to the 1970 Census. US population grew to 331.4 million in the 2020 Census, up 63%. Beef demand clearly outpaced supply as US population grows.
Beef Export and Import
Interestingly, the US both exports and imports beef. In 2021, the US exported 3.43 billion pounds of beef while imported 3.35 billion pounds. Beef export was mainly higher-grade beef cutouts. And import was lower-grade beef for processing into ground beef.
The US used to be a net import country for beef. In 2020, China signed a trade agreement with the US and opened its vast market for US beef import. This resulted in China buying four times as much beef the following year.
More export reduces domestic beef supply. This is another factor driving up beef prices.
In conclusion, the days of lower priced beef are long gone. Beef prices are expected to remain high, even though food inflation goes down.
Cattle and Hog Spread Trade – A Revisit
How could we make use of this analysis? On May 15th, I published an idea about a spread trade between CME Live Cattle Futures ( NASDAQ:LE ) and Lean Hog Futures ( NYSE:HE ).
The 20-year chart shows that the price spread between live cattle (LE) and lean hog (HE) broadly stays in the range of $20-$60 per 100 pounds but could go up to as high as $100.
On May 12th, October cattle contract (LEV3) was quoted $166.2 per 100 lbs., while October hog contract (HEV3) priced at $77.425. Thus, the price spread was $88.775.
On August 4th, LEV3 settled at $183.10 while HEV3 was closed at $83.25. The spread has widened to nearly $100.
The Impact of Proposition 12
In 2018, California passed an animal welfare law called Proposition 12. It requires that breeding pigs be confined to a pen with no less than 24 square feet of floor space, allowing them to fully turn around in their living area.
Proposition 12 applies to not only hog farmers in California, but also any supplier selling hog and pork in the state of California. The hog industry fought hard but lost. The Supreme Court upheld the law in May, and it is finally taking effect in July.
The animal welfare law significantly increases the cost of hog production nationwide. Prices of live hog, pork cutout, ham and bacon shall all go up. However, as we are now in summer, a low pork consumption season, cash market price has not yet caught up.
In my opinion, the cost factor pushing pork prices up in the short run is greater than the supply-demand force that drives up beef prices in the long run. There may be room to short the cattle-hog spread, until pork prices stabilize in a new equilibrium.
A Short Spread trade entails selling 1 CME Live Cattle Futures and buying 1 CME Lean Hog Futures. Both contracts are based on 40,000 pounds of meat and require $1,600 in initial margins.
Happy Trading.
Disclaimers
*Trade ideas cited above are for illustration only, as an integral part of a case study to demonstrate the fundamental concepts in risk management under the market scenarios being discussed. They shall not be construed as investment recommendations or advice. Nor are they used to promote any specific products, or services.
CME Real-time Market Data help identify trading set-ups and express my market views. If you have futures in your trading portfolio, you can check out on CME Group data plans available that suit your trading needs www.tradingview.com

LE1!6.21.23 This video Is about cattle markets. The video turned out a little differently than I had planned,it turned out to be the whole video before I ran out of time. But I think it went okayI will have to do a video on gold and silver which is the real reason why I got up today to do a video. If you like the video please put a thumbs up.

Steak futures updateDamn my steaks are still getting more expensive. Don't think the inflation battle is over just yet.
Can't call Powell an idiot this time since he maintained a hawkish stance, but I think the Feds are underestimating how high rates need to go since they can't reduce their balance sheet.

LE1!6.8.23 There is a reason why I suddenly picked cattle as a market that we could trade. It's a market that has tremendous profit potential and it was about to make new highs... and yet there will be tons of dead bodies.... the bodies of traders who tried to short the market.... and other bodies of Traders who went long in the market.... and they both lose money. If you do this a couple times and get burned... you will teach yourself that this Market is too risky...and too dangerous to trade. At least that was something I would have done years ago. Intuitively it makes sense because the price action is so obvious, and reversals can be so significant.... you can make significant money or lose significant money and so you think of the market is risky because you're having a hard time finding the proper trade. Markets like this offer you much more reward then Markets that are contracted and have no range. It's easy to draw the conclusion that volatile markets are too risky and contracted markets are safe and therefore less risky... which is not correct. It's time to start looking for trades in the cattle market.

GOLD LE1!6.6.23 This video Focuses on gold and the possibility that the market is going to move higher or lower... it is Unclear... and that means it's not clear To define your edge. At the end of the video I decided to show you the cattle market because I believe this is a market that will give you lots of good trades for buyers and sellers because of its volatility.... despite the fact you're looking at this when the market has made A new high.... I think it's an all-time high as I remember. Please give a thumbs up if you like the video.

What’s for Dinner: Beef or Pork?CME: Live Cattle ( CME:LE1! ), Lean Hog ( CME:HE1! )
When I started my career in commodity futures two decades ago, I took lectures from a former trader at the CME livestock pit. Mike used his favorite trade to explain the complex concept of inter-commodity spread. Here it is:
Beef and pork typically had a retail price difference of $1 per pound. For example, a local butcher shop prices pork loin roast at $1.99/lb. and ground beef at $2.99. This price relationship was stable but subject to seasonal variations. Whenever the price spread gets too large, it has the tendency to converge to the long-term mean.
Mike believed that cash market price pattern drove futures price relationship. When he observed the spread growing to $1.80, he would short the cattle-hog spread: Sell CME Live Cattle Futures and Buy CME Lean Hog Futures.
With this trade, Mike expected hog/pork prices to go up relative to cattle/beef prices, reducing the spreads in both the spot and futures markets.
This trade was remarkable in that it mainly relied on common sense and easily observable data. As long as you know beef comes from cattle and pork from hog and could go to grocery stores to check out the prices, you could handle this trade.
Could we still deploy Mike’s strategy today? The answer is yes. Comparing to the pre-Internet age, we now have a lot more data available to validate this trade idea. Therefore, besides planning a trip to Costco or Super Wal-Mart, I suggest you read on.
Cash Cattle Markets
Live cattle trades in Texas, Oklahoma, New Mexico, and Kansas averaged $170/cwt (100 pounds) for the week ending May 12th, according to USDA data. This represents a 21% gain over the year-ago price of $140. Cattle auctions in Nebraska, Iowa and Minnesota averaged $175-176/cwt last week, up 22% y/y.
USDA weekly Southern Plains cash cattle price trend shows the five-year average at around $120. Cattle price has been rising rapidly in the past three years.
Cash Hog Markets
Market hogs averaged $77.31 last week, down $30 (-28%) y/y, according to the USDA. Current price is approximately $5 below the five-year average.
The latest CPI data shows that consumer price grew at an annual rate of 4.9% as of April. While food inflation is much higher at 7.7%, the category “Meats, poultry, fish, and eggs” only logged in an increase of 2.8%.
However, not all meats are created equal. Beef price continues to go up, while pork, chicken and eggs pulled back from last year’s high prices.
WASDE Report
USDA closely monitors agricultural market conditions and publishes the monthly World Agricultural Supply and Demand Estimates (WASDE).
The latest WASDE, published on May 12th, estimated the total U.S. red meat and poultry production for 2024 at 1% below 2023 level, as lower beef and lower pork production offsets higher poultry production.
Beef production is forecast lower with expected declines in both fed and non-fed cattle supplies. Pork production is forecast slightly lower.
For 2024, cattle prices are forecast above 2023 on tighter supplies. Hog prices are forecast higher on improved demand and slightly lower supplies.
CFTC COT Report
The CFTC publishes the Commitments of Traders (COT) reports and provides a breakdown of open interest for futures and options markets. It categorizes the reportable open interest positions into four classifications:
• Producer/Merchant/Processor/User
• Swap Dealers
• Managed Money
• Other Reportable
What’s the key takeaway from the May 9th COT report on cattle and hog?
Live Cattle futures (LE)
o LE open Interest: 317,715, down 8.5% from previous week;
o Managed Money decreased long positions by 11.7%; their long/short ratio is 7.1. Speculative traders are still bullish on cattle prices, but they have started to take profit.
Lean Hog futures (HE)
o HE open Interest: 230,026, basically unchanged (-0.1%) from prior week;
o Managed Money increased short position by 14.9%; their long/short ratio is 0.68. Speculative traders are bearish on hog prices.
Cattle and Hog Spread Trade – Explanation and Illustration
The 20-year chart shows that the price spread between live cattle (LE) and lean hog (HE) broadly stays in the range of $20-$60 per 100 pounds. Whenever the price breaks out of the range, it will get pulled back in.
From January to May 2001, the spread fell nearly $50 from $45 to -$2. However, it rebounded strongly to $38 in just two months. Last May, from the bottom of $22, the spread rose all the way to $92 in March. It recently pulled back to $80, which is still well above the upper range of $20-$60.
If you study the market fundamentals in hog and cattle, you will find significant uncertainty about future price trend. However, based on historical data, it’s not unreasonable to expect the spread to narrow and converge to the mean, regardless of whether the individual prices are trending up or down.
The spread relationship holds true because of the substitution effect. High beef price would nudge consumers to lower priced pork. The change in demand in favor of pork would pump up its price relative to beef price, reducing the spread at the end.
If a trader holds this view, he could short the cattle-hog spread like what Mike did 20 years ago: Sell CME Live Cattle Futures and Buy CME Lean Hog Futures.
October cattle contract (LEV3) is quoted $166.2 per 100 lbs., while October hog contract (HEV3) priced at $77.425. on May 12th. Thus, the price spread is $88.775. Both contracts are based on 40,000 pounds of meat and require $1,600 in margins.
For the spread to narrow $1, our trade would gain $400. If the cattle-hog spread falls back to the upper range at $60, the futures account would profit $11,510. Using the initial margins of $3,200 as a cost basis, the spread trade return would be 360%.
The above example is for illustration only. Our trade would stand to lose money if the price spread did not converge. For example, if the spread widens to $92, futures account balance would be reduced by $1,290, a negative return of -40%.
Happy Trading.
Disclaimers
*Trade ideas cited above are for illustration only, as an integral part of a case study to demonstrate the fundamental concepts in risk management under the market scenarios being discussed. They shall not be construed as investment recommendations or advice. Nor are they used to promote any specific products, or services.
CME Real-time Market Data help identify trading set-ups and express my market views. If you have futures in your trading portfolio, you can check out on CME Group data plans available that suit your trading needs www.tradingview.com

A Beefy Premium.Live cattle recently hit an all-time high, leaving us wondering if the rally has gone too far. The front month contract reached 177 on April 13, surpassing the previous record set in November 2014. Meanwhile, lean hogs have been trading lower since last year.
One way to assess this trend is to look at the spread between the two livestock markets. Both the absolute price difference and the Live Cattle/Lean Hog ratio are currently at highs. The absolute price difference is at its second-highest level ever, with only March 2015 having a higher reading. The ratio spread, meanwhile, is trading at the higher end of the range since 2015.
So, what's driving this trend? Well, we could start by looking at what caused the surge in 2015. A mix of live cattle rising and lean hog prices falling contributed to the surge in the spread as cattle inventories bottomed in 2014. Looking at the current supply dynamics, we see the smallest cattle herd in eight years, with the previous low marked by the 2014 episode and hog supplies on a downtrend but still above the previous decade’s average.
As consumers become more environmentally conscious, they may prefer pork over beef due to the former’s lower environmental impact per calorie. Additionally, with the price gap between beef and pork increasing, price-sensitive consumers may switch to other protein sources as inflation continues to weigh on their mind. In the longer term, consumer preferences could flip to favour hogs over cattle.
Seasonality effects are also pointing towards an unusual year. Historically, May marks the low point for the spread as hog prices run up towards the middle of the year. However, with May already underway, the spread is not close to any lows and lean hogs are still trading down. This suggests that the current year’s spread is trading abnormally high compared to past trends.
Given that both Lean Hog & Live Cattle Futures have the same contract unit of 40,000 pounds and price quotation of US cents per pound, we can trade the spread of the two contracts using a 1:1 ratio. To express our bearish bias on the spread we can sell one contract of the Live Cattle Futures and buy one contract of the Lean Hog Futures. Keeping in mind the 2015 run took close to 1.5 years to bottom, we will place our stops further out at 110 and take profit at 45, giving the spread a longer horizon and more room to play out. Each 0.00025 increment equal to 10$.
So, will you be switching from steaks to pork chops anytime soon?
The charts above were generated using CME’s Real-Time data available on TradingView. Inspirante Trading Solutions is subscribed to both TradingView Premium and CME Real-time Market Data which allows us to identify trading set-ups in real-time and express our market opinions. If you have futures in your trading portfolio, you can check out on CME Group data plans available that suit your trading needs www.tradingview.com
Disclaimer:
The contents in this Idea are intended for information purpose only and do not constitute investment recommendation or advice. Nor are they used to promote any specific products or services. They serve as an integral part of a case study to demonstrate fundamental concepts in risk management under given market scenarios. A full version of the disclaimer is available in our profile description.
Reference:
usda.library.cornell.edu
usda.library.cornell.edu
www.cmegroup.com
www.cmegroup.com
ourworldindata.org


distribution near 2015 highfirst target is the poc
no idea on fundamentals or possible cattle ists
look above and fail
divergences
absorption
below hvn, LVA below

Brazilian cattle trend upthe brazilian cattle has showed a big move recently giving direction of buyers... for moment the trend is u´p

Brazilian cattle desease! Black swan!As i mentioned before brazilian cattle has got a trend up few weeks but today we got news about some severe problems with cattles.. now short and closed all long positions.
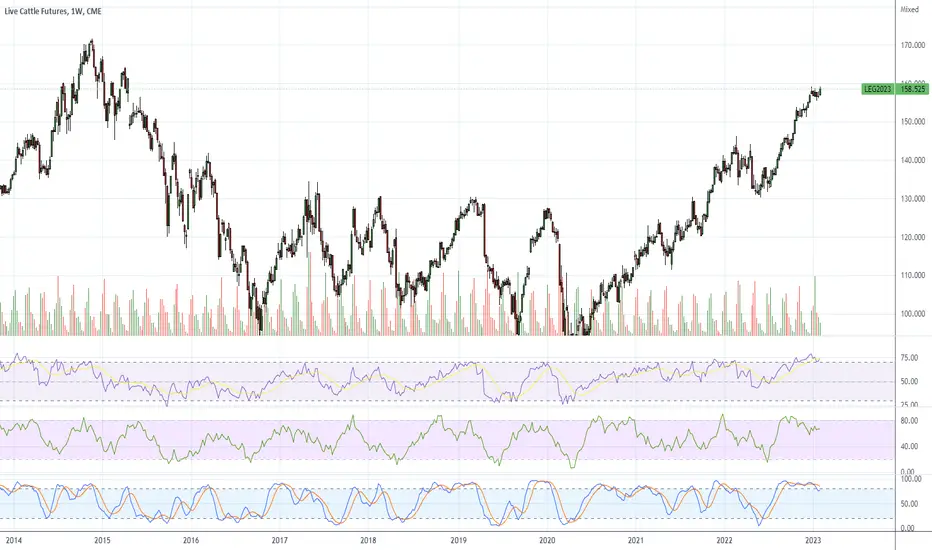
Long position - Live Cattle futuresOne of our algorithmic, trend-following systems entered long at Live Cattle futures at 149.
The system is holding the position with a guaranteed and progressive trailing stop loss of 0.3% and could average new positions if the trend is confirmed in the next weeks.
In recent weeks we have converted a few algorithmic trading programs from Pro Real Code to Python, AFL, or Pine Script with the help of Chat GPT, which shows how revolutionary AI will become in the algorithmic investing space.

Inflation gone? I don't think so. Cattle futuresThis chart shows you everything you need to know about inflation. I was shopping yesterday and my steak cost $1/lb more than last month.
If Powell doesn't go .5% today, this blow up to new ATH, and inflation will force his hand in July. Inflation isn't going away any time soon, look at gold, oil, etc. Traders are pumping commodities every time they pump the stock market.
Keep in mind .25% today and ,25% in March is already priced in and this is headed to new highs. Note: weekly chart
LE1! Futures ( LE11 ), H4 Potential for Bullish ContinuationTitle: Live Cattle Futures ( LE11 ), H4 Potential for Bullish Continuation
Type: Bullish Rise
Resistance: 159.175
Pivot: 157.875
Support: 155.375
Preferred case: Looking at the H4 chart, my overall bias for LE1! is bullish due to the current price being above the Ichimoku cloud , indicating a bullish market. Expecting price to continue heading towards the resistance at 159.175, where the previous swing high is.
Alternative scenario: Price could head back down to retest the pivot at 157.875, where the 38.2% Fibonacci line is.
Fundamentals: There are no major news.

