Let's Have A Little Fun! CHRW is lagging sector weakness, UPS and FDX have already squeeze fired short. CHRW is logistics company just the same as the other two. We lost the 200 MA and have short term EMAs lined up perfecting. Short Squeeze on 3 different timeframes and an island top. I am hoping for not only a 3 ATR squeeze but a gap fill. Will Christmas come early?
C1HR34 trade ideas

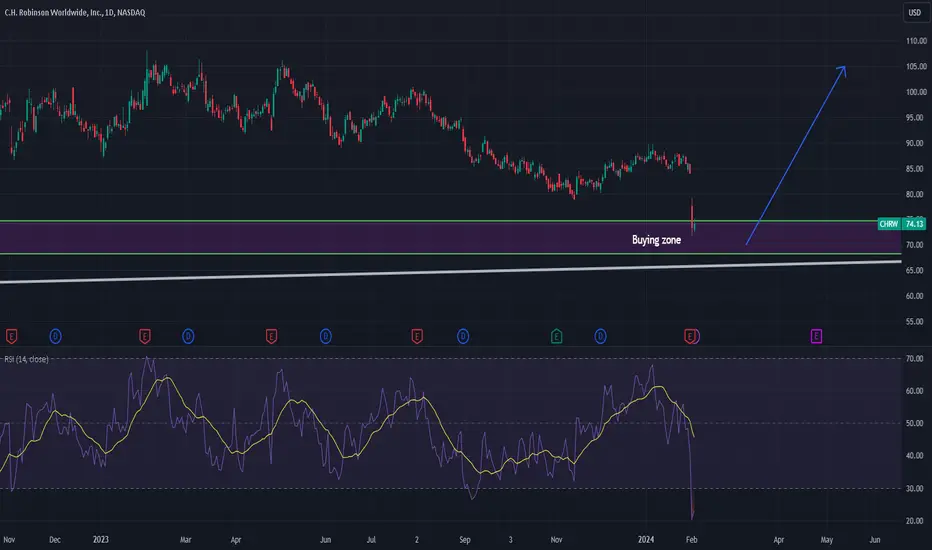
CHRW - C. H. Robinson - buyingDear traders,
Id like to share this idea in order to take long positions.
70 - 75 $ is is a good price range to look for buying opportunities.
Additionally RSI is clearly oversold and prices already went down quite aggressive.
best,
CHRW inverted H&S daily bullishFormed a great inverted H&S and retested the neckline with a solid bounce. Would look for this to continue to the 92ish range. Play with the Jan 19 '24 - 87.5/90 Bull Call Vert for better rish/reward.

$CHRW with a Bullish outlook following its earnings #Stocks The PEAD projected a Bullish outlook for $CHRW after a Positive Under reaction following its earnings release placing the stock in drift A with an expected accuracy of 100%.
Break out of base and congestion.Break out of base and congestion. Waiting for better market breadth. Good CANSLIM stock.

Robinson Armament Companylove their work and the xcrl and xcrm hope if i boost their stock they will make better guns.


CHRW LongCHRW is below it's 5Y norm P/E and above its 5Y div yld. Low end of channel. Looks great here.

$CHRW ready to move higher after breaking its ~17 month base?* Great earnings in the recent quarters
* Strong up trend
* High 3-month relative strength of 3.82 in the Industrial sector
* Has a U/D Volume Ratio of 0.94 (ideal would have been > 1)
* Pays out a generous dividend
* Breaking out of its ~17 month base
* Due to the recent volatility it had a slight pullback after its previous breakout
* Has been holding up really well over the past week when the general market was selling off like crazy. This is showing relative strength and institutional demand.
* Used the broken level as support and pushed higher from there
Trade Idea:
* It is not advised to trade breakouts in the current market conditions.
* If you want to enter with a small position, now would be a great time to enter as the price is just breaking out once again.
* If you're looking for a better entry you can look for a buying opportunity around the $105.7 area as that should continue serving as support moving forward.

CHRWBeen in this channel for 10+ years. Looks like it's trying to break out. Long way up if it does imo.

$CHRW Weekly VCP BreakoutCHRW nice VCP Pattern breakout of 100 zone resistance.
Call buyer whale MAY 105 and 110 strike , about $1.8M in premium.
Bullish confluence in indicators, EMAs opening and trending up.
Price Targets $113 and $119 - .5 and .618 FIB levels

C.H. Robinson Increases Quarterly Cash Dividend and Share RepurcCHRW: C.H. Robinson Worldwide, Inc.
2021-12-09 16:15:00
C.H. Robinson Increases Quarterly Cash Dividend and Share Repurchase Authorization

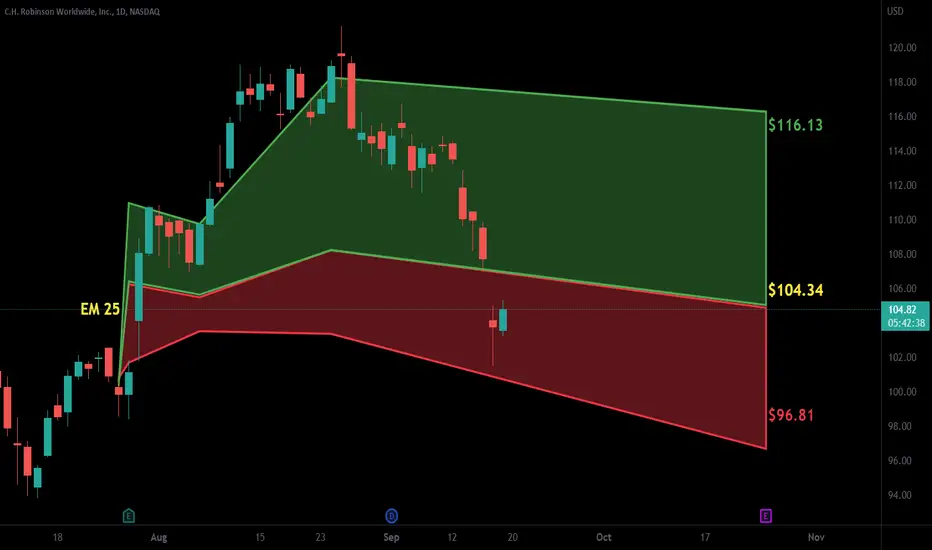
Imminent Drop For CHRW?Based on historical movement, the peak could occur anywhere in the larger red box for which we are due. The final targets are in the green boxes. The pending bottom should occur within the larger green box as has been the historical case. Half of all movement has ended in the smaller green box. In this instance, the signal indicated SELL on October 19, 2021 with a closing price of 97.56.
If this instance is successful, that means the stock should decline to at least 95.8 which is the top of the larger green box. Three-quarters of all successful signals have the stock decline 3.929% from the signal closing price. This percentage is the top of the smaller green box. Half of all successful signals have the stock decline 6.523% which is the end point of the black dotted arrow. One-quarter of all successful signals have the stock decline 12.32% from the signal closing price which is the bottom of the smaller green box. The maximum decline on record would see a move to the bottom of the larger green box. These are the same concepts for the levels in the red boxes as well.
The ends/vertical sides of the boxes are determined in a similar fashion. The trough of the decline can occur as soon as the next trading bar after signal close, while the max decline occurs within the limit of study at 35 trading bars after the signal. A 1% decline must occur over the next 35 trading bars in order to be considered a success. Three-quarters of successful movement occur after at least 7 trading bars; half occur within 13 trading bars, and one-quarter require at least 25 trading bars.
The black dotted arrow represents median historical movement. Medians are a good metric, but they are just one of many I use when forecasting future movement.
As always, the stock could decline the very next bar after the signal without looking back (therefore the red boxes would not come into play) or the stock may never decline (and the green boxes may never come into play).

FOMO *fear of missing out* diactivated😂Here you go, a great trading opportunity based on level of rollback, waiting for the stock to make a false breakdown first
❤️Please, support our work with like & comment!❤️


$CHRW - holding 50This has a lot of positive attributes. I bought calls on it from an alert trigger and already booked profits.
Now I would like to grab some commons. I would set a tight stop loss but target is 10-20% in 5-15 days
Stochastic, MACD and ATR are all supportive

$CHRW - positive indicatorsnice pennant with supportive MACD, ATR and stochastic. Alert set for breaking out of the pennant

$CHRW - on saleI like the strong technical indicators on this.
Stochastic has plenty of room to boom, MACD is primed and ready to go. ATR could not be better and bull pennant #2 is formed.
Alerts are set for detection break up or down

Reversal SetupWith earnings out of the way and the economic recovery underway, this laggard may have room to improve. Also showing rate of change divergence.
Reward/Risk: 3/1
Entry: 90.00 or at a lower price
Stop: 84.00
Target: 108.00

CHRWBased on my analysis:
1. LOW breakout down trendline.
2. MA20 cross MA 50 & price above them.
3. Stochastic bullish bias.
4. I expect CHRW will reach 99.20 USD.
Syeikh Hafiz
Stock Market Analyst

head and two shoulders pattern (OLD)"Behind every successful trader and investor, there is a lot of unsuccessful years." -
(Nayakone)

New Pairs Trade - $CHRW vs $EXPDHey guys, final update for the week, I exited the pair $CGC vs $CRON and entered a new pairs trade long $CHRW vs short $EXPD, this pair has a profitable history and looks good technically right now. I ended the week up and expect market volatility to increase over the coming weeks into the election, I've left a lot of powder dry ready to take advantage of the spikes in volatility and enter new pair trades as they present themselves.
Have a great weekend and see you for trading on Monday!
Jared.

