Corn Futures Test the 200 Day Moving AverageCorn
Seasonal Trends in Play: Short September corn from 6/13-7/27. This has been profitable for 13 of the last 15 years with the average gain being roughly 33 cents, or $1,650 per one 5,000-bushel contract.
Technicals (September): Yesterday’s USDA report was Neutral, but Neutral wasn’t enough to feed the Bull into the last trading day of the month/quarter, which triggered additional long liquidation on a break below support from 645-652 ½. That weakness carried into the overnight session and took prices a notch below our next support pocket, 624-630. The market is now the most oversold sense April of 2020. If the market is able to defend support, we could see a retracement of yesterday’s breakdown point, 645-652 ½, this will now act as significant resistance.
Bias: Neutral/Bearish
Previous Session Bias: Neutral/Bearish
Resistance: 645-652 ½****, 678 ¼-684 ½**, 697-701****
Support: 624-630****, 589 ¼***
Futures trading involves substantial risk of loss and may not be suitable for all investors. Trading advice is based on information taken from trade and statistical services and other sources Blue Line Futures, LLC believes are reliable. We do not guarantee that such information is accurate or complete and it should not be relied upon as such. Trading advice reflects our good faith judgment at a specific time and is subject to change without notice. There is no guarantee that the advice we give will result in profitable trades. All trading decisions will be made by the account holder. Past performance is not necessarily indicative of future results.
CCM1! trade ideas

Is Corn Done?Will be corn high by 4 of July SHeeSH. Corn really looks topped out here on the monthly

CORN = SHORTBroadly commodities are backing off their highs, Oil and Grains were the lone hold out's. Corn is near the top of a volatility adjusted daily risk range and a chart pattern is forming. We are taking a stab at it here.

Corn Consolidates Ahead of USDA Report
Corn
Fundamentals: Corn futures have traded both sides of unchanged in the overnight and early morning session as prices consolidate ahead of end of month, end of quarter, and all-important USDA report. The range of estimates for acres comes in from 88.4-91.0 million. In March the USDA was at 89.5. The average estimate for US corn stocks as of June 1 is 4.345 billion bushels. In last year’s report we were at 4.111.
Technicals (September): Consolidation is the name of the game as we inch closer to the highly anticipated USDA report. With the market chopping around and not really going anywhere, many of our support and resistance levels remain unchanged. Resistance levels come in near 680ish and more significantly 700ish. The upper end would be a retracement of last week’s secondary breakdown point and represents the 100-day moving average, not to mention the psychological significance. On the support side, 645-652 ½ is the pocket the Bulls want to defend.
Bias: Neutral/Bearish
Previous Session Bias: Neutral/Bearish
Resistance: 678 ¼-684 ½**, 697-701****
Support: 645-652 ½****, 624-630****, 589 ¼***
Futures trading involves substantial risk of loss and may not be suitable for all investors. Trading advice is based on information taken from trade and statistical services and other sources Blue Line Futures, LLC believes are reliable. We do not guarantee that such information is accurate or complete and it should not be relied upon as such. Trading advice reflects our good faith judgment at a specific time and is subject to change without notice. There is no guarantee that the advice we give will result in profitable trades. All trading decisions will be made by the account holder. Past performance is not necessarily indicative of future results.

Can Corn Rally Ahead of the USDA Report?Corn
Seasonal Trends in Play: Short September corn from 6/13-7/27. This has been profitable for 13 of the last 15 years with the average gain being roughly 33 cents, or $1,650 per one 5,000-bushel contract.
Fundamentals: Yesterday’s crop progress showed deteriorating crop conditions (though still better than last year at this time) with good/excellent ratings at 67%, a 3% decline. This has led to overnight relief as we inch closer to Thursday’s USDA report which will cover planted acres and quarterly stocks. The range of estimates for acres comes in from 88.4-91.0 million. In March the USDA was at 89.5. The average estimate for US corn stocks as of June 1 is 4.345 billion bushels. In last years report we were at 4.111.
Technicals (September): The market dipped lower yesterday, taking out the Thursday lows but there wasn’t much follow through selling, which led to a rally off the lows into the afternoon. We would not be surprised to see the relief continue into Thursday’s USDA report, with resistance levels coming in near 680ish and more significantly 700ish. The upper end would be a retracement of last week’s secondary breakdown point and represents the 100-day moving average, not to mention the psychological significance.
Bias: Neutral/Bearish
Previous Session Bias: Neutral/Bearish
Resistance: 678 ¼-684 ½**, 697-701****
Pivot: 645-652 ½
Support: 624-630****, 589 ¼***
Futures trading involves substantial risk of loss and may not be suitable for all investors. Trading advice is based on information taken from trade and statistical services and other sources Blue Line Futures, LLC believes are reliable. We do not guarantee that such information is accurate or complete and it should not be relied upon as such. Trading advice reflects our good faith judgment at a specific time and is subject to change without notice. There is no guarantee that the advice we give will result in profitable trades. All trading decisions will be made by the account holder. Past performance is not necessarily indicative of future results.

Corn spreadsContinuous Charts: Top – Front month to next deferred month Spread Underneath is Front Month continuous
Rule 1: Carry spreads have limits, Inverse spreads have no limits…
In the past 25-30 years we have seen 6 very strong inverted markets. Each inverted market lasted between 3-6 months and often times carried a bullish market reaction. When the inverse disappears, usually the corn market loses it’s bullish strength… None of the above inverses lasted past September. So on one hand history is strong to say that Dec/March spreads should be safe to hold some carry. But on the other hand, inverses have no rules. Risk-Reward: Don’t look to be a hero on Dec/March spreads, waiting to pick up another .05 - .07 of carry may not be worth the risk when there seems to be potential for .20 to 1.00 inverses on the table.

Will Corn Stabilize Ahead of Options Expiration
Corn (July)
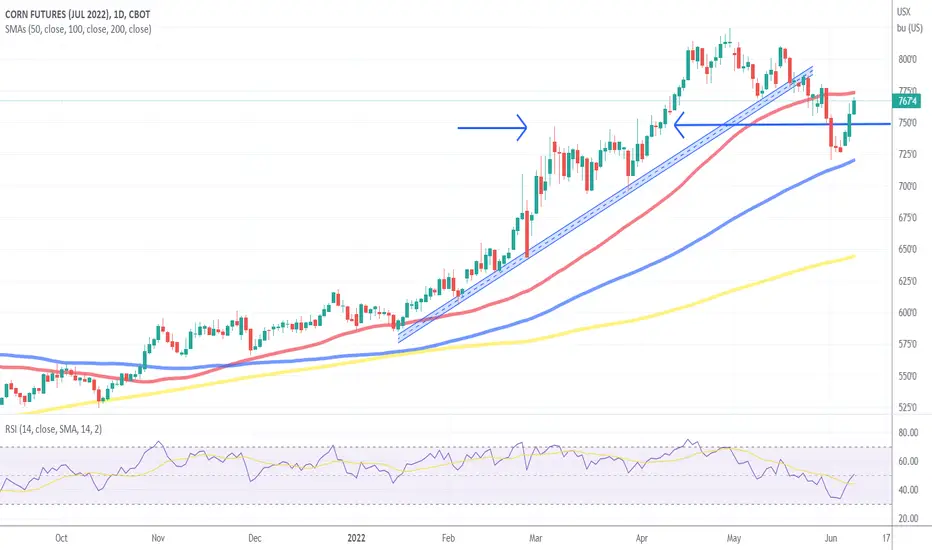
Technicals: July corn futures are weaker in the overnight/early morning trade. Though it looks ugly on the screen, we have not broken below our significant support pocket, 747-753. As mentioned from the start of the week, July options expiration may be the catalyst to help July corn futures stabilize into the end of the week. December corn….no that’s a different story. December futures have broken below the 100-day moving average and are trading at their lowest price since March 31st.
Bias: Neutral/Bearish
Previous Session Bias: Neutral/Bearish
Resistance: 800-803 ¾**, 809-810 ¼***
Pivot: 778 ¼-784 ½
Support: 747-753****, 720-726 ½****
Futures trading involves substantial risk of loss and may not be suitable for all investors. Trading advice is based on information taken from trade and statistical services and other sources Blue Line Futures, LLC believes are reliable. We do not guarantee that such information is accurate or complete and it should not be relied upon as such. Trading advice reflects our good faith judgment at a specific time and is subject to change without notice. There is no guarantee that the advice we give will result in profitable trades. All trading decisions will be made by the account holder. Past performance is not necessarily indicative of future results.

Corn futures - A bearish wave is in the making - Short ?Chart is suggesting a bearish impulse in the making - lower highs - and lower lows on the daily

Corn Futures Test and Defend Significant Support Corn
Technicals: In yesterday’s morning report we wrote that the early morning weakness below the 50-day moving average (near 780), stating that it “opens the door for a potential retest of significant support from 747-753”. That support was tested and held to a T through the session and in the overnight/early morning trade. Now it’s up to the Bulls to defend it during the regular trading hours. One thing that might help is this week’s options expiration. There is a lot of open interest in the 750 strike, which may help the market consolidate, we talked about this in yesterday afternoon’s Tech Talk. Feel free to reach out with questions or to get these videos.
Bias: Neutral/Bearish
Previous Session Bias: Neutral/Bearish
Resistance: 800-803 ¾**, 809-810 ¼***
Pivot: 778 ¼-784 ½
Support: 747-753****, 720-726 ½****
Futures trading involves substantial risk of loss and may not be suitable for all investors. Trading advice is based on information taken from trade and statistical services and other sources Blue Line Futures, LLC believes are reliable. We do not guarantee that such information is accurate or complete and it should not be relied upon as such. Trading advice reflects our good faith judgment at a specific time and is subject to change without notice. There is no guarantee that the advice we give will result in profitable trades. All trading decisions will be made by the account holder. Past performance is not necessarily indicative of future results.

Corn Futures RetreatCorn
Commitments of Traders Update: Friday’s CoT report showed Managed Money were net buyers of 13,858 futures/options through June 14th. This expands their net long position to 278,185. Broken down that is 329,725 longs VS 51,540 shorts.
Technicals: Corn futures were sharply higher on Friday morning, but posted their high within the first minute of the “floor open”, which happened to be right at our first resistance point, 800. The rest of the day was steady selling, pressing prices into negative territory by the close. That weakness has spilled into the overnight and early morning trade, following a long weekend. The market has broken below the 50-day moving average which opens the door for a potential retest of significant support from 747-753
Bias: Neutral/Bearish
Previous Session Bias: Neutral/Bearish
Resistance: 800-803 ¾**, 809-810 ¼***
Pivot: 789 ½-790
Support: 747-753****, 720-726 ½****
Futures trading involves substantial risk of loss and may not be suitable for all investors. Trading advice is based on information taken from trade and statistical services and other sources Blue Line Futures, LLC believes are reliable. We do not guarantee that such information is accurate or complete and it should not be relied upon as such. Trading advice reflects our good faith judgment at a specific time and is subject to change without notice. There is no guarantee that the advice we give will result in profitable trades. All trading decisions will be made by the account holder. Past performance is not necessarily indicative of future results.

ZC CORN - Done Busted OutYeah, yeah, it can consolidate.
Knee-High by July.
Seems output is dropping, significantly.
Tortillas?
Corn Chips?
Fritos?
Yeah, all heading higher.

CORN FUTURES (ZC1!), H1 Potential for Bullish RiseType : Bullish Rise
Resistance : 800'0
Pivot: 782'2
Support : 770'6
Preferred Case: On the H1, price is moving above the ichimoku cloud and within the ascending channel which supports our bullish bias that price will rise from the pivot at 782'2 where the overlap support, 78.6% fibonacci projection and 50% fibonacci retracement are to the 1st resistance at 800'0 in line with the swing high resistance.
Alternative scenario: Alternatively, price may break pivot structure and drop to the 1st support at 770'6 in line with the overlap support and 78.6% fibonacci retracement .
Fundamentals: Since both countries, Russia and Ukraine, are major exporter of agriculture goods and their persistent war will lead to a shortage of agricultural goods and give us a bullish bias for corn .

Corn futures - double top April 24thDouble top is a reasonable call for around April 24th 2023. Safer target of 826 in January is noted as there is always the possibility of a rapid decline afterwards, presenting the risk of investors selling earlier to avoid further risk.
Thrilling times in the world of corn.

i think the wheart will do this SN before blow upthe whaet will blow up becuase the inflation in the usa and the oil too remeber that

Corn Tests Significant Resistance Corn
Seasonal Trends in Play: Short September corn from 6/13-7/27. This has been profitable for 13 of the last 15 years with the average gain being roughly 33 cents, or $1,650 per one 5,000-bushel contract.
Fundamentals: This morning’s weekly export sales report showed net sales of 140,900 MT for 2021/2022--a marketing-year low--were down 50 percent from the previous week and 45 percent from the prior 4-week average. Net sales of 138,900 MT were reported for 2022/2023
Technicals: Corn futures are marching higher in the early morning trade, taking prices back to the top end of the recent range. A breakout and close above here could spur another run back at and above the psychologically significant $8.00 marker.
Bias: Neutral/Bearish
Previous Session Bias: Neutral/Bearish
Resistance: 789 ½-790 ½**, 800-803 ¾**, 809-810 ¼***
Pivot: 776-778
Support: 769-773 ½**, 747-753****, 720-726 ½****
Futures trading involves substantial risk of loss and may not be suitable for all investors. Trading advice is based on information taken from trade and statistical services and other sources Blue Line Futures, LLC believes are reliable. We do not guarantee that such information is accurate or complete and it should not be relied upon as such. Trading advice reflects our good faith judgment at a specific time and is subject to change without notice. There is no guarantee that the advice we give will result in profitable trades. All trading decisions will be made by the account holder. Past performance is not necessarily indicative of future results.

This Corn Seasonal is in PlayCorn
Seasonal Trends in Play: Short September corn from 6/13-7/27. This has been profitable for 13 of the last 15 years with the average gain being roughly 33 cents, or $1,650 per one 5,000-bushel contract.
Technicals: Corn futures were able to defend the previous day's low during yesterday's session but didn't do much to change the technical outlook. Our pivot pocket remains intact, that comes in from 769-773 1/2. trendline resistance and the 50-day moving average come in just above that, near 776-778. On the support side of things, 747-753 is the significant pocket and potential inflection point. If the Bulls fail to defend that pocket, we could see long liquidation take us back to the lows from two weeks ago, in the mid 720s.
Bias: Neutral/Bearish
Previous Session Bias: Neutral/Bearish
Resistance: 776-778*** 789 ½-790 ½**, 800-803 ¾**, 809-810 ¼***
Pivot: 769-773 ½
Support: 747-753****, 720-726 ½****
Futures trading involves substantial risk of loss and may not be suitable for all investors. Trading advice is based on information taken from trade and statistical services and other sources Blue Line Futures, LLC believes are reliable. We do not guarantee that such information is accurate or complete and it should not be relied upon as such. Trading advice reflects our good faith judgment at a specific time and is subject to change without notice. There is no guarantee that the advice we give will result in profitable trades. All trading decisions will be made by the account holder. Past performance is not necessarily indicative of future results.

Daily Corn Market Update: Fundamental/Techncial Analysis 6.14.22Corn
Fundamentals: Yesterday’s weekly Crop Progress report showed corn is 97% planted, 88% emerged, and Good/Excellent conditions at 72%. All within the range of expectations. Yesterday’s weekly export inspections came in at 1,199,976. This was also within the range of expectations. Dr. Cordonnier increased Brazilian corn production by 3mmt to 110mmt. The USDA is at 116mmt, we believe the market is pricing in somewhere in the middle of those two estimates.
Technicals (July): July corn futures were lower yesterday, but finished off the lows, closing right near our pivot pocket, 769-773 ½. We are seeing some of yesterday’s weakness spill over into the overnight/early morning session following yesterday afternoon’s crop progress report. Technical levels remain largely intact. Resistance remains intact from 789 ½-790 ½. A continued failure to reclaim ground above here would mark a lower high, which would keep the door open for a potential lower low and a drop back to the 100-day moving average, 726 ½. The inflection point for a bigger drop would be a break and close below 747-753.
Bias: Neutral/Bearish
Previous Session Bias: Neutral/Bearish
Resistance: 789 ½-790 ½**, 800-803 ¾**, 809-810 ¼***
Pivot: 769-773 ½
Support: 747-753****, 720-726 ½****
Futures trading involves substantial risk of loss and may not be suitable for all investors. Trading advice is based on information taken from trade and statistical services and other sources Blue Line Futures, LLC believes are reliable. We do not guarantee that such information is accurate or complete and it should not be relied upon as such. Trading advice reflects our good faith judgment at a specific time and is subject to change without notice. There is no guarantee that the advice we give will result in profitable trades. All trading decisions will be made by the account holder. Past performance is not necessarily indicative of future results.

Corn: Buy, Sell, or Hold?Corn
Fundamentals: Outside markets are under significant pressure this morning, but corn futures have so far been able to brush that off. Hot and dry forecasts have some market participants concerned, keep in mind that hot and dry forecasts are not abnormal for this time of year. The weekly crop progress report will be out after the close. Corn is expected to be just shy of 100% planted. 100% of what will continue to be the ongoing debate. Good/Excellent ratings are expected to come in near 73%. Last year at this time the crop was rated 68% G/E.
Commitments of Traders Update: Friday’s CoT report showed Managed Money were net sellers of 7,108 futures/options contracts, through June 7th. This shrinks their net long position to 239,592. Broken down, that is 307,876 longs VS 68,284 shorts.
Technicals (July): Corn futures had an impressive week, rallying and completing a full retracement of the May 31st/June1st selloff. If the Bulls can find some follow through momentum this week and chew through technical resistance, we could see an extension take prices back near $8.00. A failure to get out above 789 ½-790 ½ would mark a lower high, which would keep the door open for a potential lower low and a drop back to the 100-day moving average, 723 ½.
Bias: Neutral/Bearish
Previous Session Bias: Neutral
Resistance: 789 ½-790 ½**, 800-803 ¾**, 809-810 ¼***
Pivot: 769-773 ½
Support: 747-753****, 720-723 1/8****
Futures trading involves substantial risk of loss and may not be suitable for all investors. Trading advice is based on information taken from trade and statistical services and other sources Blue Line Futures, LLC believes are reliable. We do not guarantee that such information is accurate or complete and it should not be relied upon as such. Trading advice reflects our good faith judgment at a specific time and is subject to change without notice. There is no guarantee that the advice we give will result in profitable trades. All trading decisions will be made by the account holder. Past performance is not necessarily indicative of future results.

Technical Update for July CornCorn (July)
Technicals: July corn futures were able to chew through significant resistance during yesterday’s session, which has opened the door for an extension towards our next resistance pocket, 769-773. This pocket represents the lower high from the end of May, as well as the 50-day moving average. If the Bulls can keep the momentum going and chew through this resistance pocket, a retest of the psychologically significant $8.00 handle wouldn’t be out of the question.
Bias: Neutral
Previous Session Bias: Neutral/Bearish
Resistance: 769-773 ½***, 789 ½-790 ½**, 800-803 ¾**
Support: 747-753****, 729-733**, 716-720 ½****
Rolling Front Month Corn FuturesThis tracks the front month futures of corn. This tracks the front month futures of corn. This tracks the front month futures of corn. This tracks the front month futures of corn. This tracks the front month futures of corn. This tracks the front month futures of corn. This tracks the front month futures of corn. This tracks the front month futures of corn. This tracks the front month futures of corn. This tracks the front month futures of corn. This tracks the front month futures of corn. This tracks the front month futures of corn. This tracks the front month futures of corn. This tracks the front month futures of corn. This tracks the front month futures of corn.

Corn Testing Significant Resistance LevelsCorn
Fundamentals: Yesterday’s Crop Progress report showed that the U.S. corn crop is 94% planted, 1% ahead of expectations and 2% ahead of historical average trends. 78% of the crop has emerged with 73% being rated in good/excellent condition, 5% better than the average analyst estimate. Futures have brushed off the good conditions and are finding strength as concerns over dryer forecasts add back some premium to the markets.
Technicals: Corn futures opened last night lower but have found strength two cents above our first support and have rallied back into positive territory, taking prices back into our 4-star resistance pocket, 747-753. As mentioned in yesterday’s report “This is a pocket we would consider selling into as it provides a well-defined risk-reward setup, in our opinion.”. A break and close above resistance is your sign to take the L and look for another setup. Our next resistance pocket for July corn above 753 doesn’t come in until 769-773.
Bias: Neutral/Bearish
Previous Session Bias: Neutral/Bearish
Resistance: 747-753****, 769-773***, 789 ½-790 ½**, 800-803 ¾**
Support: 729-733**, 716-720 ½****
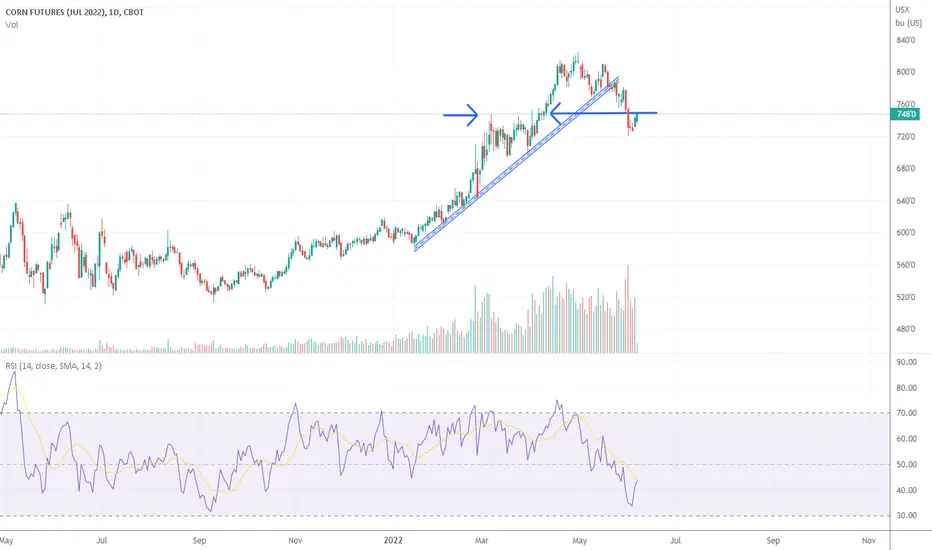
Corn Futures Revisit the Scene of the Crime The Scene of the Crime
Previous support and last week's breakdown point from 747-750 will now act as first resistance form July corn. The recent trend of lower highs and lower lows keeps the advantage in the Bears favor. Consecutive closes above resistance could neutralize the technical damage and take prices back to the recent lower high, 775. Crop progress will be out this afternoon which could set the tone for the overnight trade.
