CCM1! trade ideas

Short on CornOn a downtrend, the corn is performing an upswing. My short side starts with the loss of the last minimum price.
My stop is quite interesting, above yesterday´s high and my target is the last dip...or the middle of the andrew´s pitchfork .

Is King Corn about to flex its muscles?Looks the strongest ag. Today.
Waiting. WiIll The King the lead? Or fail like the other ags?


CORN Deflation.!Weekly short target. Might go lower.
Some problem is current El Nino there might give some volatility before target hit.!


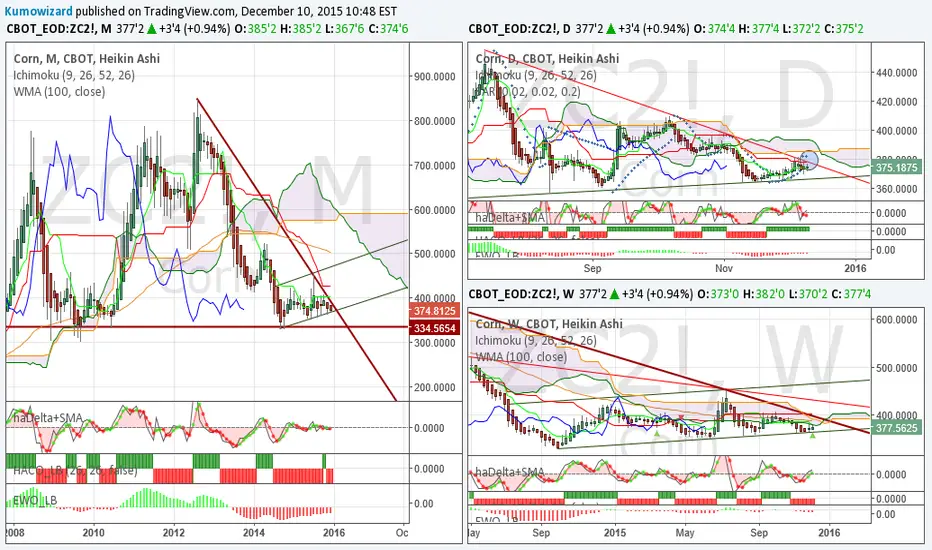
If 347-350 holds... decision time soon: key 372+Weekly:
- Range extremely tight now! Major bearish tremdline on top side ard 372, horizontal resistance and possible bullish channel on the lower side ard 345-350
- If price breaks above 372, we could see a big short squeeze
- Heikin-Ashi shows undecision, but with positive divergnece in weekly haDelta
Daily:
- Spike again from key resistance of 347-350, but Ichimoku setup is still bearish.
- Trendline, Kijun, Kumo and 100 WMA has to be broken for further gains. However if Price breaks 368-372, that will be a very strong indication for more Bullish action, in line with the weekly chart! It would be similar to the one we saw last July!
- Heikin Ashi early signal for reversal
Strategy: Hold small long, and do not be shy to leverage up bullish position if you see 372 breaking!

King Corn false breakoutNo bottom in site. Break of 347 confirms. Break back above current T/L at 370 suggests signs of reversal.

Corn Long Term IdeaCorn, shows them in his past aggressiveness very agitated and violent movements, and possibly in future also this is his behavior, reacion, added to it, it is clearly a cone shape, taking into whether the price, and giving its characteristic shape, plus you can see the possible formation of a huge formation type "W", which appears to have a huge reacion future.

How about some "POP" Corn?Corn is ripe for the picking and ready to POP. With glut of corn in silo's we like the downside...BUT, this can either way. Be nimble. We expect a nice 6-8 day run.


Reminder - #Corn Key levelsChart reflects to ZCH6 (March/16) contract.
Upper side:
- 381 -> Daily Kijun, Daily bearish trendline
- 401 -> Daily bullish Kumo breakout validation / Weekly and Monthly bearish trendline breaks / Monthly Tenkan Sen / Weekly Kijun Sen !
Lower side:
- Bullish reversal idea would be invalidated below 363
Price not much changed since last post. Quite firm between daily Tenkan and Kijun. Next break attempt above 381 could accelerate into a short squeeze.
Strategy: Hold 0,5 or maximum 1 risk unit long. Leverage up on firm breaks above bullish upper key levels! Stop at/below 363.

Corn update - Chance for bullish reversal improvesWeekly:
- Remarkable doji Heikin-Ashi candle now from key supp/res. The candle did not have a lower low.
Daily:
- Ichimoku setup back to neutral. Kijun Sen may be tested soon at 380!
- Heikin Ashi is firm bullish. haDelta goes higher, it shows momentum gain.
- EWO closing up to zero
Bullish acceleration is expected above 380, but the real game changer would be 400!
Can not post 4H here but I already did it on Twitter this morning.4H Ichimoku setup turned to bullish! Pull backs to 374-375 can be bought!
I increased my longs a bit yesterday.
