CVX: oil prices are on the rise. Trading idea for 28/09/2023Oil prices for benchmark brands Brent and WTI are confidently surging towards 100 USD per barrel. In Q3 2023, the value of "black gold" has already soared by 30%. Revenues of companies within the oil and gas sector promise to be substantial at the end of the year. Moreover, such firms typically pay attractive dividends to investors.
Considering these developments, it is compelling to take a closer look at the stocks of energy companies. Today, our focus is on the Chevron Corporation chart (NYSE: CVX), one of the world's leaders in the oil and gas industry.
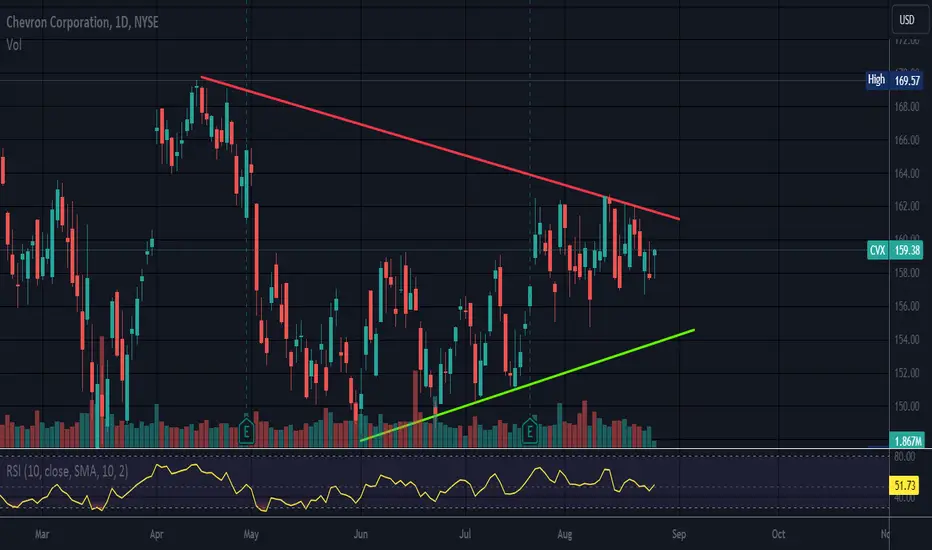
On the D1 timeframe, support lies at 167.01, with resistance at 168.52. This level was broken through on Wednesday 27 September 2023, and a new resistance level is yet to be established. There is also a clear upward trend on the H1 timeframe. In the short term, there is a potential price increase to 185.25, and in the medium term, a rise to 192.75 is likely.
—
Ideas and other content presented on this page should not be considered as guidance for trading or an investment advice. RoboMarkets bears no responsibility for trading results based on trading opinions described in these analytical reviews.
The material presented and the information contained herein is for information purposes only and in no way should be considered as the provision of investment advice for the purposes of Investment Firms Law L. 87(I)/2017 of the Republic of Cyprus or any other form of personal advice or recommendation, which relates to certain types of transactions with certain types of financial instruments.
Risk Warning: CFDs are complex instruments and come with a high risk of losing money rapidly due to leverage. 72.87% of retail investor accounts lose money when trading CFDs with this provider. You should consider whether you understand how CFDs work and whether you can afford to take the high risk of losing your money.
CHVX34 trade ideas

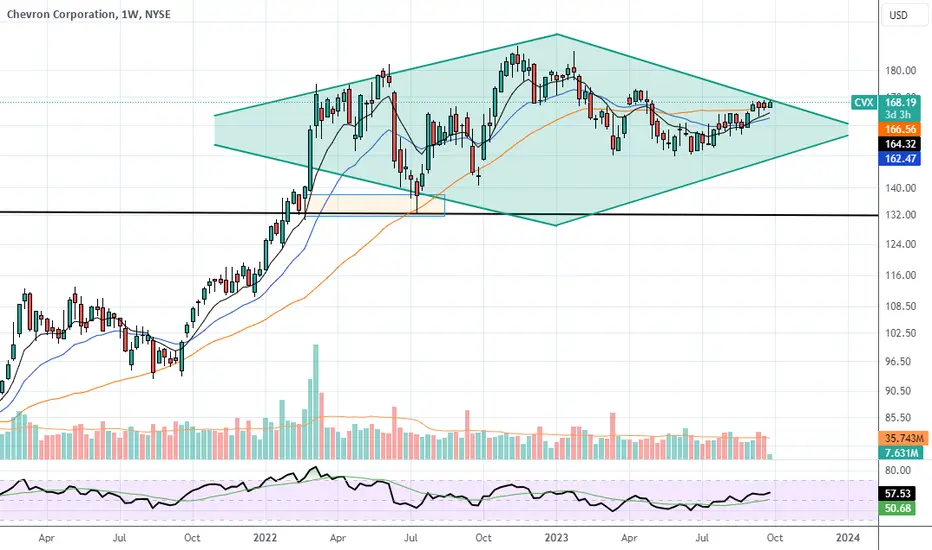
CHEVRON 1D Golden Cross ahead. Can it finally break out?Chevron Corporation (CVX) has been trading within a long-term Triangle pattern, which has potentially funneled the price action lately to a Rectangle. The key development for the next few days is the emerging Golden Cross on the 1D time-frame, the first since October 28 2021. Technically, this has the ability to break both above the Rectangle (Resistance 1 at 173.00) as well as the Triangle (Lower Highs trend-line).
The 1D RSI Higher Lows are supporting this action, so if we close a 1D candle above Resistance 1 (173.00) we will buy and target 180.00 (Lower Highs of Triangle). Then if upon a short-term pull-back the 1D MA50 holds, we will re-enter and target 188.00 (Resistance 2).
-------------------------------------------------------------------------------
** Please LIKE 👍, FOLLOW ✅, SHARE 🙌 and COMMENT ✍ if you enjoy this idea! Also share your ideas and charts in the comments section below! **
-------------------------------------------------------------------------------
💸💸💸💸💸💸
👇 👇 👇 👇 👇 👇

CVX, Major CONTINUATION-SETUP, Sector Rally, BREAKOUT INCOMING!Hello There!
Welcome to my new analysis about CVX on several timeframe perspectives. The oil market since the corona pandemic supply-shock dynamics has formed a important dynamic and had the ability to form a major rebound recovery with several new highs being formed and CVX having the ability to bounce into a new all-time-high. Now a big part of the dynamic is the consideration of if CVX has the potential to continue with this established formation and with the established trend moving on with further determinations.
CVX on the local timeframe perspective is building this main wedge formation with great supports above the 140-150 area. If this wedge formation completes with the appropriate momentum breakout this will activate initial target-zones and above this considering the whole global big picture CVX is forming a much larger formation here with the broadening-wedge-formation on the global perspective being completed once the breakout of the local formation also setup. With the projection of this formation targets above 400 will be activated.
In this manner, thank you everybody for watching the analysis, support from your side is greatly appreciated.
VP

CVXDiamond top or diamond continuation pattern? Or is it even a valid diamond pattern at all? Let me know your thoughts.
Chevron Corporation, week#39As long it's price didn't close below $165.00, you can add some of it shares
We set our target at $174.42

Top 3 🔥 Hot Stocks You Can Buy TodayBuying stocks can be a challenge
but with this strategy, you will be able
--
to see what is required of you to buy
or sell
--
It's a very simple but powerful ''Rocket Booster Strategy''
Watch this video to learn more
--
-Disclaimer-
I am not a financial advisor, and the information
provided here is for informational purposes only.
Stock trading and investing involve risks,
and past performance does not guarantee future
results. It's important to conduct your own
research and consult with a qualified
financial advisor before making any investment decisions.
Always be aware of the potential for loss,
and consider your risk tolerance
and investment goals before
engaging in any trading activities.
The content provided here does not constitute
financial advice, and I do not take responsibility
for any financial decisions made based on this information.
--
remember to rocket boost this content to learn more

Chevron (CVX) Corporation down it goesDuring the past few weeks, we are seeing a period of selling accumulation. This is because the price has managed to break below the long-term uptrend trendline, indicating a change in sentiment.
The most recent pullback shows that CVC didn't have enough steam to break above the downtrend trendline, yet again increasing the probability of further decline. We are taking this signal and will update you on the progress.

Chevron broke out of the $164 resistance...On Friday, Chevron broke out of the $164 resistance and settled at $167.21. A daily close above $168 may extend this rally towards the April-May 2023 high of around $173. In contrast, a daily close below $164 may drag prices down towards the $156
support.


$CVX - Falling Trend Channel [MID-TERM]🔹Rectangle Formation produced a POSITIVE signal at a breakout resistance of 160.
🔹Marginally broken up through resistance at 164, next resistance at 173.
🔹RSI curve indicates a rising trend, indicating an early indication of a possible upward trend reversal for the price.
🔹Technically POSITIVE for the medium long term.
Chart Pattern:
◦ DT: Double Top | BEARISH | 🔴
◦ DB: Double Bottom | BULLISH | 🟢
◦ HNS: Head & Shoulder | BEARISH | 🔴
◦ REC: Rectangle | 🔵
◦ iHNS: inverse head & Shoulder | BULLISH | 🟢
Verify it first and believe later.
WavePoint ❤️

CVX near term $168 OIL is on the move, this play on CVX will gain momentum when we close above 200d ma above 165.
new targets to look for above and a few gaps to fill.
keep an eye on USOIL and UKOIL.


$CVX with a neutral outlook following its earnings #StocksThe PEAD projected a neutral outlook for NYSE:CVX after a negative over reaction following its earnings release placing the stock in drift C with an expected accuracy of 45.45%.

Chevron in a range.Chevron Corporation - 30d expiry - We look to Buy at 157.22 (stop at 154.02)
We look to trade the current range.
156.22 has been pivotal.
Support is located at 157 and should stem dips to this area.
We look to buy dips.
The primary trend remains bullish.
Our profit targets will be 165.22 and 167.22
Resistance: 162.00 / 164.25 / 166.00
Support: 159.00 / 156.22 / 154.00
Please be advised that the information presented on TradingView is provided to Vantage (‘Vantage Global Limited’, ‘we’) by a third-party provider (‘Everest Fortune Group’). Please be reminded that you are solely responsible for the trading decisions on your account. There is a very high degree of risk involved in trading. Any information and/or content is intended entirely for research, educational and informational purposes only and does not constitute investment or consultation advice or investment strategy. The information is not tailored to the investment needs of any specific person and therefore does not involve a consideration of any of the investment objectives, financial situation or needs of any viewer that may receive it. Kindly also note that past performance is not a reliable indicator of future results. Actual results may differ materially from those anticipated in forward-looking or past performance statements. We assume no liability as to the accuracy or completeness of any of the information and/or content provided herein and the Company cannot be held responsible for any omission, mistake nor for any loss or damage including without limitation to any loss of profit which may arise from reliance on any information supplied by Everest Fortune Group

Chevron, or oil stocks in general look ready to outperform s&P50If you just take a look at the chart, you can see we have had the deviation below support, broke back above, and are currently retesting.
this implies to me, that at the very least, Oil stocks , or chevron specifically, will keep pace with the s&p500 at the very least, until it is ready to massively outperform.

Chevron Corporation, for week#35Closed in green in the past 3 days, but not good enough volume.
Wait till it above $160.02, or the volume indicator confirms

Symmetrical TriangleNeutral until broken.
Some would measure the wide end of the triangle and project it from the up or down from the point of the break be it up or down.
No recommendation
CVX Trying to Move UpCVX consolidated for two months from May to July 2023 (larger rectangle). Moved up slightly and started consolidating again. Price is now above 20/50/100 EMAs and just below 200 EMA. Likely to break 200 EMA soon. Uptrend to start by end-August with PT of 180 by end-2023.

Technical and digital analysisWe notice that we are in the process of a small correction for the downside, and there is an increase in the selling momentum, and we wait for the buying momentum to weaken in the correction, and we sell,

CVX - One more leg downI´m considering this whole sideways movement to be a flat correction.
Therefore, blue wave C would occur in 5 subwaves, giving me the expectation of a new lower low below 150.
Invalidation is at 172.88.


CVX Bearish TrendAfter large spike in gas/oil prices recently a correction is in order. Looking for this bearish trend to continue and for CVX to retest resistance before going to support.

Rotation from tech to energySure tech can have another couple % up as the rotation is underway, but this chart looks quite convincing to me especially with the weekly bullish div on the macd.
Then we have a bullish engulfing weekly candle...
Atop of that, last week Cramer said this oil rally should be faded.
Buffet has been buying oil (oxy) which is also an interesting play. Although he is not an immediate reversal signal, it shows that the valuation of these companies is at a good area in his eyes.
I would love a small pullback tomorrow but I am not sure we get that. The entry now is not bad, the stoploss would be below the channel which is only 5% loss ish, for an implied 30+% move up.
