This 3 Step System Is Called The Rocket Booster StrategyIn this video i give you the full demonstration of the
3 step system called the rocket booster strategy
using the new and improved screener by
trading view
The rocket booster strategy is as follows:
-The price has to be above the 50 EMA
-The price has to be above the 200 EMA
-The price has to gap up
In this video you will see
how to do it right here on tradingview
no fluff just striaght to the point
Trade safe
Remember to rocket boost this
content to learn more.
Disclaimer: Trading is risky you will lose money whether
you like it or not
please learn risk management and profit taking strategies
and feel free to use a simulation trading account
before you trade with real money.
COCA34 trade ideas

Free Report #2:The SImple Guide To Trading Stock OptionsThis is the 3 Step Strategy
Am going to show you in this video
to help you with trading stock options.
Watch it to learn more.
#1-Wait for Momentum/Rate Of Change/ Bull Power indicator
#2-Wait for a candlestick chart pattern confirmation
#3-Use the Rocket Booster Strategy
If you want to learn more check out the resources and rocket boost this content
Disclaimer: Trading is risky please learn
risk management and profit taking strategies.
Also feel free to use a simulation trading account.

Rocket Booster Strategy + The #1 Indicator Power Force TeamThis #1 indicator helped me find this stock
which is trending on twitter right now
honest to you i didnt think
i would find it using this indicator but am glad
i did.This is why am sharing it with you
today.
In this video i also show you the rocket booster strategy
which is as follows:
Step#1-The price has to be above the 50 SMA
Step#2-The price has to be above the 200 SMA
Step#3-The price should gap up in a trend
The last step is very important because
it shows you the price correction of the chart
you have decided to trade
Rocket boost this content to learn more
Disclaimer:Trading is risky please learn
risk management
and profit taking strategies
Also feel free to use simulation trading
account before you trade with real money


Coca-Cola: As PlannedAs primarily anticipated, Coca-Cola has recently established the peak of wave in magenta just below the resistance at $73.53. The stock then dropped by approximately 5%. We now expect the low of wave in magenta to occur soon, and afterward, wave should bring significant gains, thus completing the large wave III in beige. Our Target Zone for this wave III top lies between $75.42 and $78.88. It provides opportunities to either close existing long positions or to open new short trades.

Cliff Fall for Coca-Cola. KOProbabilistically, yes. OBOS out, MIDAS cross, VWAP/US superior to candle, BB%PCT cross of zero line, VZO dropping and bearish. Stoch is deeply divergent. All this is is a game of trades, good luck out there.

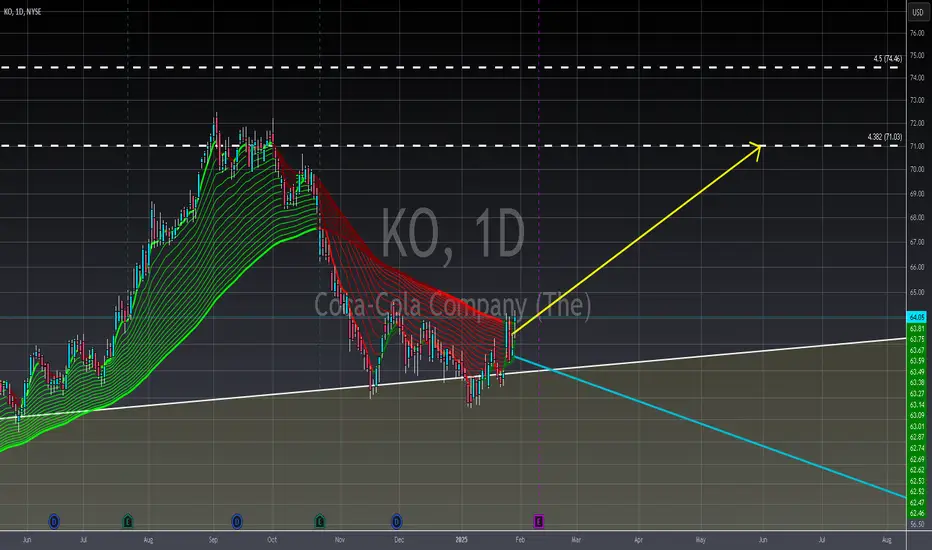
$KO potential breakout NYSE:KO looks good for a breakout and a measured move to 83 IF it can break and close above 72.5.

Coca-Cola Wave Analysis – 3 March 2025
Coca-Cola reversed from round support level 70.00
Likely to rise to resistance level 72.45
Coca-Cola recently reversed up sharply from the round support level 70.00, former resistance from October.
The upward reversal from the support level 70.00 continues the active short-term impulse wave 3 of the sharp impulse wave (3) from January.
Coca-Cola can be expected to rise to the next resistance level 72.45 (top of the Shooting Star from October) – followed by the resistance level 73.45 (multi-month high from last September).

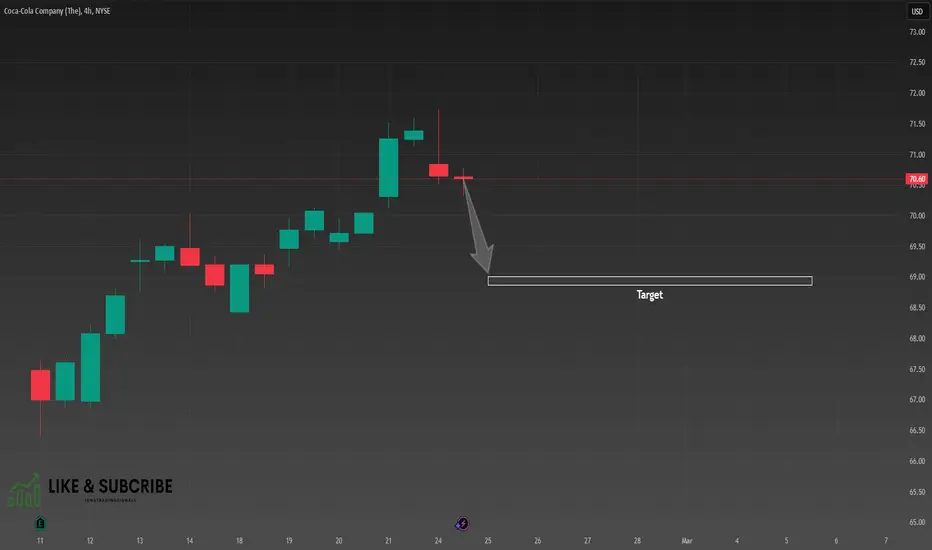
KO, Short, 4H✅ KO rejected the key resistance at 71.30, signaling a bearish move. The price is expected to decline toward the support at 69.00.
SHORT 📉
✅ Like and subscribe to never miss a new analysis! ✅
Coca-Cola: High in Sight?!Coca-Cola has gained around 9% over the past two weeks and should now be approaching the high of the turquoise wave 4. As soon as this top is established (below the resistance at $70.74), we expect sell-offs down to the forecast low of wave (A) in magenta below the support at $60.62. However, if the stock breaks above the resistances at $70.74 and $73.53 during its current upward move, we will consider wave alt.(A) in magenta as complete. In this scenario, the subsequent wave alt.(B) would already be underway, aiming for a high within our beige Target Zone between $75.32 and $80.36 (probability: 39%).

KO: Exponential Scaling e^0.1 Progression RateCoca-Cola (KO) has demonstrated a strong long-term uptrend, as evidenced by its price action on the exponential scale chart spanning from the 1960s to early 2025. The chart, utilizing the natural constant e (Euler) with a progression rate of 0.1, effectively highlights the stock’s exponential growth over decades. Early price movements were relatively stagnant, but KO experienced a significant boom in the 1980s and 1990s, driven by global expansion and brand dominance. This period of rapid growth was followed by a notable correction in the late 1990s and early 2000s, where the stock experienced multi-year consolidation before resuming its uptrend. The 2010s marked a major breakout, pushing KO to consistent all-time highs, and despite market fluctuations, the company has maintained a steady upward trajectory into the 2020s. Recently, KO has approached key resistance levels near $70-$72, with its current price hovering around $68.70. If the stock successfully breaks above these resistance levels, it could aim for new highs above $75, reinforcing its long-term bullish outlook. However, if a pullback occurs, key support levels to monitor are around $64-$60, with stronger support near $52-$55, where historical price consolidations have taken place. Given its ability to maintain higher highs and higher lows, KO remains a strong blue-chip investment, benefiting from brand stability, global market penetration, and steady dividend payouts. Investors should watch for breakouts above $72 as a signal for continued bullish momentum or potential dips to support levels as opportunities for accumulation. The exponential grid structure suggests that KO’s price growth follows a logarithmic trend, further confirming its long-term compounding potential.

Coco-cola for the KO!
Good Morning Everyone,
Week 2 into February and looking for the next hot opportunity.
KO has been identified as a high potential gainer over the next few months. (earnings to follow this morning)
Keeping the monthly and quarterly VWAP to our underside as support and the marketcipher money flow curvature showing the way as our leading indicator is suggesting this stock was undervalued for some time but maybe not for long.
Long entry was taken a few days ago and as we watch it develop more updates are to come.
Cheers, Uni
P.S if you enjoy the indicators i share, please message for more details on how you can get it for yourself. From time to time discount codes do come available during certain times of the year.
And as always trade safely and look before you leap.

KO: Sell ideaHello Traders!!! On KO this configuration of the chart tells us that we would have a high probability of having a bearish trend over a time unit of one hour. But, this will be confirmed by the strong break of the support line and the vwap.

Coca-Cola (KO) Stock Surges Nearly 5% in a DayCoca-Cola (KO) Stock Surges Nearly 5% in a Day
Yesterday, shares of The Coca-Cola Company (KO) saw a significant rally, climbing nearly 5% and reaching a yearly high above $67. The last time KO stock traded at this level was in late October 2024. Investor optimism was fueled by the release of the company’s Q4 financial report, which exceeded expectations:
→ Reported earnings per share: $0.55 vs. expected $0.52
→ Gross revenue: $11.5 billion vs. forecasted $10.7 billion
Additionally, Coca-Cola announced:
→ A substantial market share increase in the non-alcoholic beverage sector and $10.8 billion in free cash flow.
→ Projections for 5–6% organic revenue growth in 2025, highlighting the company’s resilience amid economic uncertainty.
Technical Analysis of Coca-Cola (KO) Stock
At yesterday’s market open, KO formed a large bullish gap, which may act as future support. Meanwhile, price extremes outline an ascending channel pattern.
If optimism persists:
→ The price may move towards the channel median, where supply and demand tend to balance (similar to early 2025).
→ Bears might become active around $69.25, a level that has previously influenced price movements (indicated by arrows).
Analysts' Price Forecast for Coca-Cola (KO) Stock
Following the earnings report, analysts from leading investment firms have acknowledged Coca-Cola’s strong performance, either reaffirming or raising their price targets for KO stock:
→ Citi maintained a "Buy" rating with a $85 price target.
→ Jefferies reiterated its "Buy" rating with a target of $75.
→ UBS kept its "Buy" rating, setting a $72 target.
According to TipRanks:
→ 12 out of 13 surveyed analysts recommend buying KO stock.
→ The 12-month average price target for KO is $72.4.
Trade on TradingView with FXOpen. Consider opening an account and access over 700 markets with tight spreads from 0.0 pips and low commissions from $1.50 per lot.
This article represents the opinion of the Companies operating under the FXOpen brand only. It is not to be construed as an offer, solicitation, or recommendation with respect to products and services provided by the Companies operating under the FXOpen brand, nor is it to be considered financial advice.

KO: Buy ideaBuy idea on KO because we have the breakout with force the resistance Line by a big green candle follow by a large green volume....

KO Earnings incomingonly a beginner trader and this is not financial advice. I am only using Trading views paper version for practice and have seen a lot of videos on social media regarding boycott of KO after the recent ICE raids. The earnings is for last year Q4 but I feel even if earnings is beat we could see a down fall before a long bullish run. I could be wrong and please share any ideas or tips if you have any.

Coca-Cola To Report Q4 Earnings Today Ahead of Market OpenCan the Beverage Giant Sustain Its Momentum?
Coca-Cola (NYSE: KO) is set to report its fourth-quarter earnings results on Tuesday, February 11,2025 ahead of the market open. Investors and traders are closely watching the stock, which has already shown premarket strength, rising 0.20% early Tuesday morning. With the Relative Strength Index (RSI) at 60.84, market participants are anticipating a potential bullish continuation, provided earnings results meet or exceed expectations.
Strong Performance in 2023
Coca-Cola, a global leader in the beverage industry, has continued to demonstrate resilience despite economic uncertainties. In 2023, the company reported $45.75 billion in revenue, marking a 6.39% increase from the previous year’s $43 billion. Earnings also saw an impressive 12.28% growth, reaching $10.71 billion. This performance underscores Coca-Cola’s ability to maintain steady growth through product diversification and strategic market positioning.
Analysts remain optimistic about the stock, with 17 analysts giving KO a consensus rating of "Strong Buy." The 12-month price target of $72.18 suggests a potential 11.82% upside from its latest price, reinforcing bullish sentiment ahead of the earnings report.
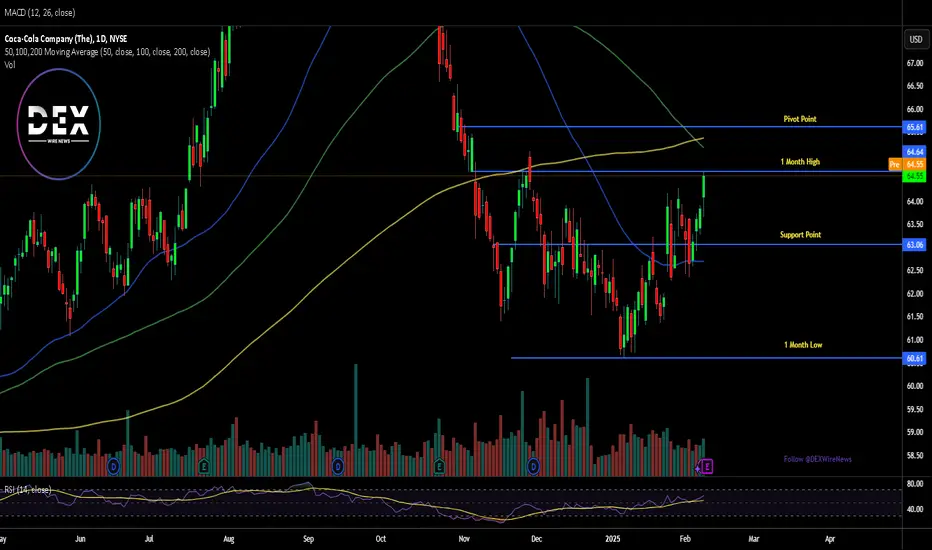
Technical Analysis
As of Tuesday’s premarket session, NYSE:KO is trending upwards, with its price hovering near $65, a key pivot and resistance level. Breaking this barrier could trigger a bullish rally, potentially pushing KO toward higher price targets in the coming weeks.
However, if earnings disappoint, a retracement may be in play, with immediate support aligning with the 38.2% Fibonacci retracement level at $63. This level could serve as a critical point for a potential rebound, should selling pressure emerge following the earnings announcement.
What to Expect Post-Earnings
A strong earnings beat could propel KO further into bullish territory, confirming its upward trajectory and attracting more institutional interest. On the flip side, weaker-than-expected results may lead to a temporary pullback, offering a potential buying opportunity at key support levels.

COCA-COLA: bottomed and started the 2025 rally to $82.The Coca-Cola company just turned bullish on its 1D technical outlook (RSI = 56.409, MACD = 0.210, ADX = 24.907) as it crossed over the 1D MA50 following a clean HL at the bottom of the long term Channel Up. The 1D RSI is already on a bullish divergence and this validates technically the start of the new bullish wave. The previous one increased by +42.18% so a target significantly below it (TP = 82.00) is more than justified long term.
See how our prior idea has worked out:
## If you like our free content follow our profile to get more daily ideas. ##
## Comments and likes are greatly appreciated. ##

KO - Daily - Tariff ConcernsClick Here🖱️ and scroll down👇 for the technicals, and more behind this analysis!!!
________________________________________________________
________________________________________________________
..........✋NFA👍..........
📈Technical/Fundamental/Target Standpoint⬅️
1.) Potential Negative Impacts:
- Increased Production Costs: Tariffs on Mexican goods will likely increase Coca-Cola's production costs, as a significant portion of its beverages are produced in Mexico.
- Reduced Profit Margins: These increased costs will likely be passed down to consumers in the form of higher prices. This could lead to reduced demand for Coca-Cola products, impacting profit margins.
- Potential for Lower Q1 2025 Earnings: The full impact of tariffs may not be immediately felt, but it could negatively affect Q1 2025 earnings as companies adjust to the new cost structure.
2.) Factors Mitigating Potential Negative Impacts:
- Strong Consumer Demand: Coca-Cola products are highly popular worldwide, and consumers may continue to purchase them despite price increases.
- Diversified Portfolio: Coca-Cola's portfolio extends beyond just the core soda brand, including brands like Vitaminwater, Monster, and Bodyarmor, which may offer some insulation from the impact of tariffs.
- Consistent Growth: Coca-Cola has demonstrated consistent growth in recent years, suggesting strong underlying demand for its products.
3.) Technical Outlook:
- Potential for a Move Up: Despite the potential headwinds from tariffs, the technical outlook suggests a potential for an upward move in the stock price.
- Potential Downside Targets: If the stock price declines, it may find support in the $59-$61 range.
- Potential Upside Target: If the stock price moves higher, it may target the $71 range.
🌎Global Market Sentiment⬅️
1.) Historically, February has shown a mixed performance pattern. While it has been positive more often than not in recent decades, it's not always a consistently strong month.
==============================
...🎉🎉🎉Before You Go🎉🎉🎉…
==============================
Leave a like👍 and/or comment💬.
We appreciate and value everyone's feedback!
- RoninAITrader
The 3 Powerful Steps To Risk ManagementIts not easy to say what you really mean to your friends
yesterday I got into an argument with
one of my buddies.I told him
I have to do my own roll
He got upset because he wanted me
to use his roll.
Honestly after listening to some hip-hop music
and the artist in the song
said "Do you own roll"
What this means is that in life you have to learn
how to be independent
Yes its okay to depend for help
but that dependence should not
be permanent even a child
some time has to learn how to walk
it wont be easy
but the child will learn how to walk and
won't need to be carried around anymore
Its the same with risk management
when you use sell-stop orders
you are learning to be independent from
the market makers
and instead telling them what to do instead of them
making the orders for you
This is very important that's why I designed
the risk management booster strategy
This is how I found the sell order for NYSE:KO
This strategy has 3 steps;
-Use pivot point indicators
-Use sell-stop orders
-Use buy-stop orders
These 3 steps are the key to risk management
and trading safely
If you want to learn more
rocket boost this content
Disclaimer: Trading is risky please learn
risk management and profit
taking strategies.
Also, feel free to use a
simulation trading account
before you trade with real money.


The Fizz is Back: Coca-Cola's Stock on the Rebound● The price had encountered several resistance points around the $62 mark in the past.
● Once it broke through this barrier, the stock surged to reach a record high of $72.5.
● However, it then faced a significant pullback, dropping approximately 16% before finding support at the breakout area.
● Recently, the price has begun to climb once more, setting its sights on the previous all-time high, with expectations of surpassing it.
