COWC34 trade ideas


COST coiled enough!!Costco Coiled enough tightly for breakout .Earnings on may 25th. Would love to take some option contracts ending the week following .Defintely worth watching the Breakout of symmetrical triangle.!!! Good luck.

$COST Weekly chart looks ripeHas been holding up long term support well and it just needs to break the trendline to go higher. It might take next earnings to propel it upwards.

$COST Blow off top - Long CallCostco consolidating here... getting ready for a big move... Majority are going to expect a down turn here... but we could easily Moon

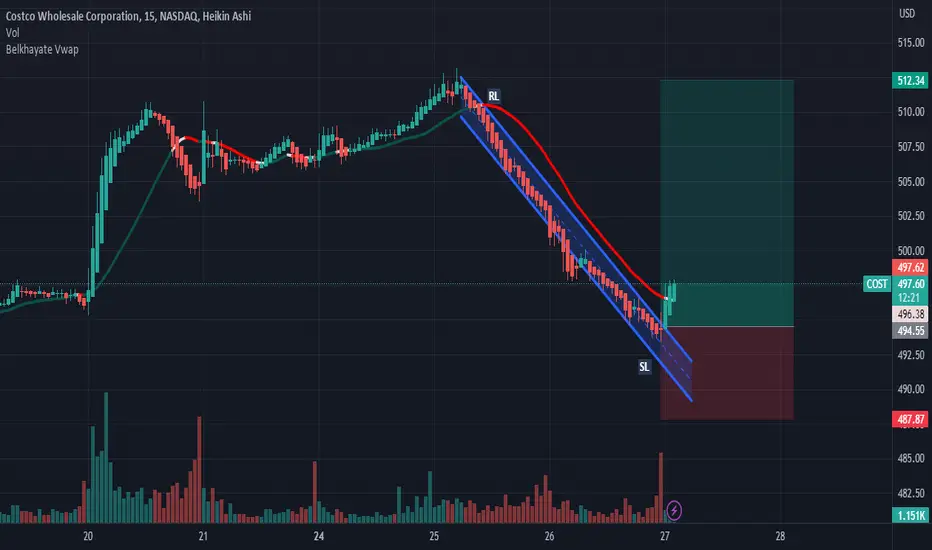
COST: Buy ideaOn COST we have the breakout of vwap indicator so we will have a big probability to have an uptrend.Thanks!
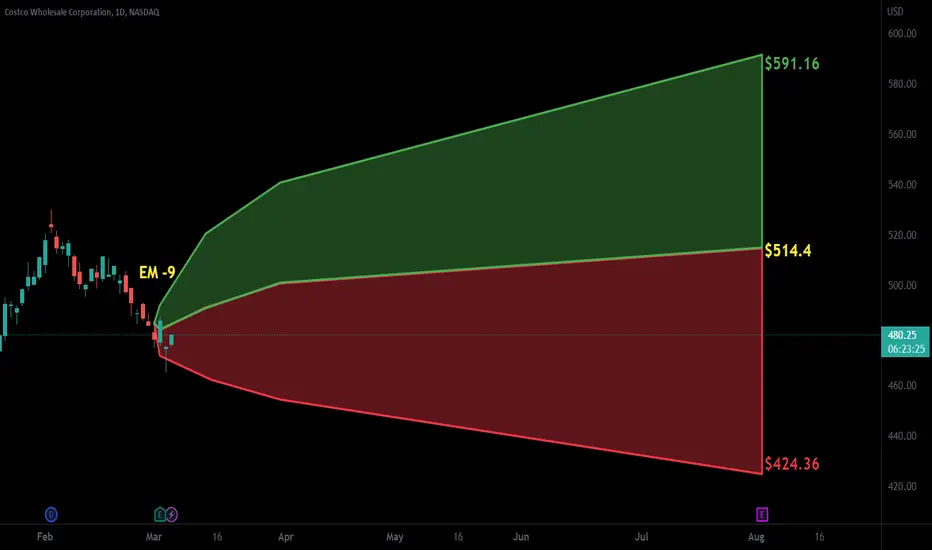
COST Symmetrical triangle On the chart we can see symmetrical triangle formation which is neutral pattern.
In order to trade it you have to wait for the breakout with the volume increase.
Target both for short and long are shown on the chart.

$COST trade is coming upNASDAQ:COST is breaking below the rising wedge 502 which is opening a nice short trade with a good risk to reward or buying put options. Target is 470-480 zone

Symmetrical TriangleThis could also be called a large Descending Triangle.
Top line is a descending or a diagonal resistance line indicating lower highs with each swing up. This line must be broken to reach higher targets. T1 is in larger green type than T2.
Both patterns are neutral until broken.
Price is trying to bust through the .236 today of the trend up.
No recommendation.

04/20/23 Visual View of COSTCOBull Case:
- Has always commanded a premium
- Strong revenue growth
- Solid Return on Equity
- Dividend Safety
Bear Case:
- Way over valued with P/E = 36
- Will be tough to maintain dominance if we fall further into recession

Costco Faces a Potential Make-or-Break MomentCostco has been a steady performer for years, but now the warehouse retailer may be showing signs of exhaustion.
The first pattern on today’s chart is the falling trendline that began last April and the rising trendline from last May. The convergence of the two has produced a triangle, with prices currently nearing the end of the formation. Does this show buyers steadily losing interest?
Second, the 50-day simple moving average (SMA) slipped below the 200-day SMA in October and has remained there since. It’s different from the rest of the market, suggesting that the longer-term trend may have weakened.
Third, notice how prices tried to move above the 200-day SMA and failed after COST reported lower same-store sales on April 6. The shares have also struggled at the 50-day SMA.
Finally, relative strength versus the S&P 500 has been mostly negative since the broader market started climbing in October. This may indicate COST -- with its relatively high valuation -- is losing favor as investors shift to new stocks.
TradeStation has, for decades, advanced the trading industry, providing access to stocks, options, futures and cryptocurrencies. See our Overview for more.
Important Information
TradeStation Securities, Inc., TradeStation Crypto, Inc., and TradeStation Technologies, Inc. are each wholly owned subsidiaries of TradeStation Group, Inc., all operating, and providing products and services, under the TradeStation brand and trademark. TradeStation Crypto, Inc. offers to self-directed investors and traders cryptocurrency brokerage services. It is neither licensed with the SEC or the CFTC nor is it a Member of NFA. When applying for, or purchasing, accounts, subscriptions, products, and services, it is important that you know which company you will be dealing with. Please click here for further important information explaining what this means.
This content is for informational and educational purposes only. This is not a recommendation regarding any investment or investment strategy. Any opinions expressed herein are those of the author and do not represent the views or opinions of TradeStation or any of its affiliates.
Investing involves risks. Past performance, whether actual or indicated by historical tests of strategies, is no guarantee of future performance or success. There is a possibility that you may sustain a loss equal to or greater than your entire investment regardless of which asset class you trade (equities, options, futures, or digital assets); therefore, you should not invest or risk money that you cannot afford to lose. Before trading any asset class, first read the relevant risk disclosure statements on the Important Documents page, found here: www.tradestation.com .

stdev retracements for U.S equitiesIm currently looking at NASDAQ:TEAM , NYSE:MCD , NASDAQ:PAYX and NASDAQ:TSLA for mean reversion opportunities. Awaiting monthly adj,close data for the month of April.

COST | Bearish ABCD PatternWe have observed Bearish ABCD Pattern. We will take entry of sell stop if the trend reverses from point D which is also a Potential reversal Zone (PRZ) after the confirmation of bearish divergence on RSI and new trend formation with LHs and LLs.

Buying Costco at a discount. COSTTriangle/Three drives within an upgoing zigzag. We more often now base stop loss off a moving ATR, as testing had shown this to be a more effective strategy than mere price levels alone. Yet, ATR is not always an option.
We are not in the business of getting every prediction right, no one ever does and that is not the aim of the game. The Fibonacci targets are highlighted in green with invalidation in red. Confirmation level, where relevant, is a pink dotted, finite line. Fibonacci goals, it is prudent to suggest, are nothing more than mere fractally evident and therefore statistically likely levels that the market will go to. Having said that, the market will always do what it wants and always has a mind of its own. Therefore, none of this is financial advice, so do your own research and rely only on your own analysis. Trading is a true one man sport. Good luck out there and stay safe.

cost SHORTCOST SHORT
it will rise up till the trendline - then it is going to go down as per the levels shown .

COST| Bullish Trend Continuation | Bullish RectangleACHUSDT is showing Bullish Trend Continuation forming Bullish Rectangle along with the price synced with the RSI . We will place buy stop order along with SL and TPs .

Bullish pattern ?COST shows a bullish pattern
A double bottom structure is also seen on the 1-hour chart, and the 250 SMA position is a test for the index (around 495), where day traders can take profit and wait for opportunities.
Swing traders can stop the profit taking part and add to their positions depending on the strength of the pullback. The target position could be around the previous high of 528. Stop loss will be around the previous low of 466.

COST: Doubling Down on PutsFound more opportunity to buy puts on COST today as the price started edging closer to the 20 SMA. Still expecting a flush in equities in the coming weeks, so looking at 450 as my price target and an eventual breakthrough to the downside of the descending triangle.


COST 1WWhy do I expect price to move below 408 USD?
Firstly, let's look at the chart.
What can you can read from the chart?
Price has been creating lowers highs (LH) and higher lows (HL) for several months
Price is below local PoC.
Weak lower high
What do I expect will happen based on my readings?
Price is currently below local PoC. It has created weak higher low (weak structure). I believe that price will break the weak lower high and move below 408 USD.


COST: Descending TriangleCOST has formed a descending triangle and first target is 450. Once that breaks down, long term targets is 405.

$COST with a bullish outlook following its earnings #StocksThe PEAD projected a bullish outlook for $COST after a Negative over reaction following its earnings release placing the stock in drift C with an expected accuracy of 70%.