CTGP34 trade ideas


C getting ready gain!!!Mac d about to cross over and trendline might break . Resistance is holding so far. Let's see next week. I'm looking for shorts...


Range bound in rising channel Citigroup price has been in a rising channel since Febuary. Currently pushing against the 200 EMA. I'm bullish until this thing drops down out of the channel
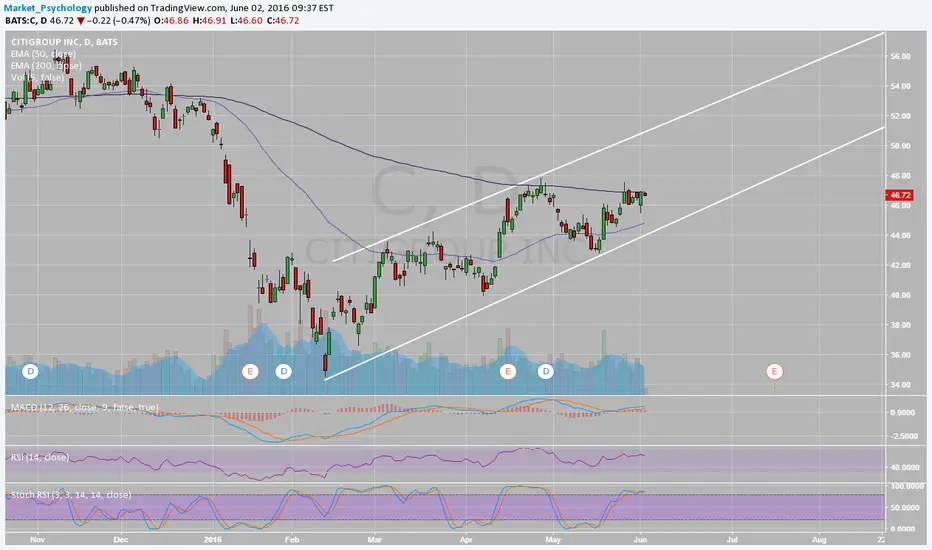
(D) If bullish momo continues and 45 remains near term supportthen, long entries near the bottom of the mild bullish channel could be decent as it glides towards 50.
RSI and MACD have room above before showing signs of exhaustion. Of course it may retest 45 or P pivot support before going higher.
Stalk your entry and follow your rules.


Citigroup in uptrend R/R = 4Citigroup is an upside channel and the stock reacted positively on the news that there might be an interest hike in June 2016 by the Fed as this might improve their operational margins

A great shorting oppSome serious overhead resistance. Pick your spots, but some great targets below...


Sell C.....This is bearish in my eyes...
Weekly:
-Trendline supp gone
-Another trend line will poss break soon
-Ichimoku bearish
-Close below Kijun is a nice sell opportunity
Thought to share with you guys


CITIGROUP head and shoulders patternPattern is confirmed, now I am waiting for pullback to advancing neckline area around 44 to enter long position. There is enough room to 52.

Getting Ready to Explode from Bolinger Band SqueezeBuy at 43.45 with a stop at $27.80.
This trade is not alot of shares but has huge upside potential if what we are seeing is a true bottom.


CitiThis week I am watching CitiGroup $C along with some more financial stocks but, we’re focusing on CitiGroup $C. Back in January CitiGroup $C tried to held the $41.68 but, failed miserably and made a low at $34.43. We are not quickly to test $44-45 after the first test of $44.15 but, we had slightly higher high and lows in the triangle but, They made a low that I pointed out earlier. This week will be a key role for CitiGroup $C because of earnings for the first quarter but, we have 4 days to see the setup into the number. I really want to see if we can get out of the $40's.


