DUKB34 trade ideas
DUK on another rally in price corridor, bounce off of 200 SMA?Hello Traders!
Duke Energy Corp has been moving in a price corridor for almost 4 months now. The support at the bottom of the corridor is clear, but the resistance could be either at 91 or it is the 200 SMA. The 200 SMA will definitely be reached, given that the RSI is far away from being overbought, the recent crossing of the MACD over the 9 EMA, and the 50 SMA crossing over the 100 SMA just now. The price crossing over both the 50 and the 100 SMA will most likely give it enough momentum to reach the 91 support/resistance as well.
VF Investment cannot be held responsible for any financial damages suffered from following our well-funded but personal opinions and trading ideas.
Please, maintain proper position sizing and risk management!
DUK Setting UpDUK
ENTRY = 78-81 (or above the .5 @ 82.96 if we do not get a dip prior) to the upward move)
1st Target = 618fib @ 87.88
2nd Target = 91
HODL Target = 786fib @ 95 (top of regression trend)
____________________________________________
This content is for informational and educational purposes only. This is not in any way, shape or form financial or trading advice.
Good luck, happy trading and stay chill,
2degreez
Pair Trading Idea DUK/XELDUK and XEL have a 84,3% correlation over 60 market days.
Applying some of the most popular indicators on the pair DUK/XEL shows an interesting pattern. While XEL has been clearly outperforming DUK since several weeks, a trend reversal seems to occur. DUK might catch up in the coming days and weeks. The daily and the weekly RSI (1st indicator at the top "Ultimate RSI Multi Timeframe"), the Wave Trend Oscillator (2nd one) and the ultimate MACD oscillator (3rd one from the top) reversed recently from their lower ranges. The Squeeze Momentum Indicator (at the bottom) shows a nice divergence, which is also observable on the RSI .
The setup is worth being given a shot: Short XEL, Long DUK . The strategy is market-neutral and is profitable when DUK starts to outperform XEL.
Follow me to get regular pair trading ideas!
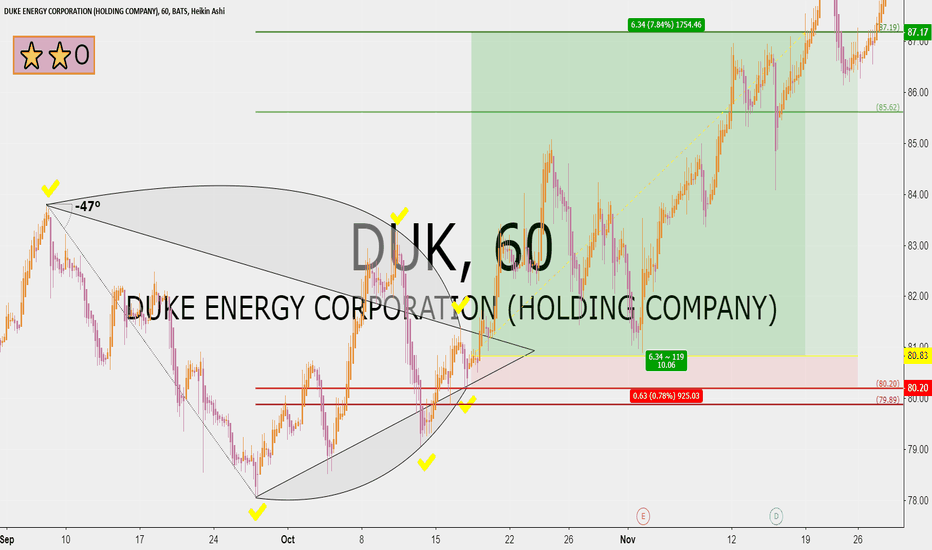
Duke Energy 10 RRR upsideTrading Methodology:
1. An asymmetric bullish/bearish pennant is drawn using ascending and descending curved trend lines with a minimum of three price action touche points per line. The direction is determined by the previous trend.
2. The angle tool is applied from the earliest two trend touch points, beginning at the earliest touch point.
3. A trend-based Fibonacci retracement triangle is drawn starting from the earliest trend touch point and ending at the earliest touch point of the opposite trend line .
4. Based on the degree, of the earlier defined angle, the appropriate (and secret) levels are selected for the fibonacci retracement ; two levels for stop-loss and two levels for take-profit. The closest stop-loss level to the current price level is the top priority stop-loss. Though the secondary stop-loss level is often chosen for some markets such as FX and some equities in order to account for seldom unexpected resistance breaks. The greater target level is the top priority, and where majority of the shares are sold, though some may choose to close part of the position at the first target level or set it to be the stop-loss once price exceeds it. Entries should be laddered in around the levels closest of the yellow line.
This trading strategy can be applied to any market and time frame, and positions most often garner the greatest risk-to-reward ratio with the highest success rate. What more can you ask for? I will only be posting my unique trading strategy until EOY. I work solely with price action to identify pennants and apply unique trend-based fibonacci retracement levels for SL and TP levels. Reach out to me if you have any questions.


