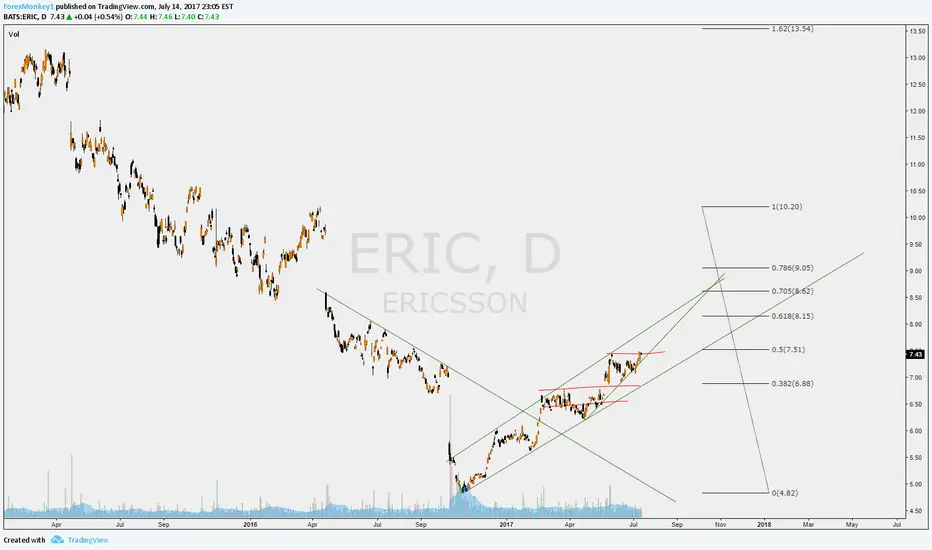
BULLISH INDICATORS! BUYERIC looks like it's ready to run!
On the daily chart, if the stock price can break above $8.90, it should hit $10 to $12
Every indicator on the daily chart is BULLISH
As for the Weekly Chart goes...
Every indicator on the Weekly is BULLISH
POSITION: 500,000 SHARES
COST: $8.50
E1RI34 trade ideas

#ERIC #long #stock #15minuteERIC has formed an ugly inverse H&S. overall this stock is in a downtrend, however, on the 15 minute chart it looks like a reversal is in the works. I think you can set a target for the .618 with a 6.78 target.


$eric ascending triangle on intermediatehigher timeframe is in defined uptrend and finding support on trendline
intermediate time frame is in accumulation phase after short markdown showing price action making higher highs and higher lows on trendline
moving towards the .236 retracement level of 7.30
rsi is confirming the move and has room to run and break resistance
lowertime frame is showing alignment in consolidation in upper range in resistance area of 7.3x - will watch price action from there
possibly breakout of resistance and pullback- slowly finding its way to the 7.43 area and watching for a breakout of that resistance are

***Update*** Ericson - Waiting for short entryThere is nothing new under the sun.
Waiting and applying the stuff that works. You don´t have to trade every single asset or take every single opportunity, just wait for teh stuff that you understand to happen.
Warren Buffet recently said, he would have never baught Micrsoft or Amazon because he didn´t understand their model. But he understood Coca Cola and PetroChina and that´s more than fine.
I hope can show some traders what I have on the watchlist and if they understand the reasoning behing I may have added some value to the community

ERICSSONTelefonaktiebolaget LM Ericsson (Ericsson) provides infrastructure, services and software to the telecommunication industry and other sectors. The Company's segments include Networks, IT & Cloud and Media. The Networks segment consists of two business units: Network Products and Network Services. The overall focus is on evolving and managing access networks, including the development of hardware and software for radio access and transport networks. The IT & Cloud business includes two business units: IT & Cloud Products and IT & Cloud Services. The focus in IT & Cloud is to help telecom operators and selected enterprises through the digital transformations ahead. It develops and delivers software-based solutions for television and media and combines a product portfolio that spans the television value chain, with systems integration and managed services. The portfolio includes compression, content publishing through set-top box or pure over-the-top, content delivery and analytics.

Sideways consolidation, monitor for a breakout.Monitor for a breakout above US$6.63.
Target: US$6.99-US$7.19.
Support: US$6.38


High Risk buyAround an old support level so its worth a look, but this is a downtrend and prior gaps were not filled.

PRICE ACTION/VSA LONG ON ERICA symmetrical triangle pattern with increasing demand volume on down wave culminating in today's AV (Accumulation Volume) VSA bar, down bar with mid to up close on high volume. Further strengthened by the support found on triangle trendline. This is an aggressive entry. A more conservative entry would be to wait for further signs of strength and a NS (No supply) or TOS (Test of Supply) bar, AKA low volume pullback.
Entry on break of high of signal bar. Initial stop at low of signal bar. First target is previous resistance level with R:R of 1:3.13. Second target at prior higher high with a R:R of 1:5.6. Third target at a measured move of first leg of triangle with R:R of 1:6.47.

BEGINNING OF UPTRENDThis week, price has finished is retracement towards the red downsloping U-MLH and initiated an upward move towards the black ML line. Price target is 17.41.
This is a long term trade that will last 5-6 months with move completing in May - Jun 2015.
