E2NP34 trade ideas


ENPHASE ENERGY (ENPH) Short Play: Bearish Momentum Building!Technical Analysis:
Enphase Energy (ENPH) on the 15-minute timeframe signals a solid short trade setup. The price is moving steadily below the Risological dotted trendline, showing sustained bearish pressure with room for the price to descend further.
Key Levels:
Entry: 78.13
Stop Loss (SL): 85.38
Target 1 (TP1): 69.18
Target 2 (TP2): 54.69
Target 3 (TP3): 40.20
Target 4 (TP4): 31.2
5
Observations:
The price is consolidating near the entry, showing potential to test the lower targets.
The Risological dotted trendline continues to act as overhead resistance, indicating a strong bearish outlook.
Enphase Energy is positioned for a potential decline with all targets set. Traders should watch for a breakdown below TP1 to confirm continued bearish momentum and aim for deeper targets!

Back with another value stock for playing the next 4 years The Foxx is back.
After a stellar success of ALTM, I dont think I have to mention to my esteemed followers the power of value investing.
I wont give you all the jagron of the DCF and the P/E Multiples on this platform but feel free to DM me for additonal info.
ENPH, my new entry. Previously, I did not mention my holdings in ALTM but to put things in perspective, i owned 100,000 stocks at 2.21 of ALTM. Sold 50,000 at 4.9 and 50,000 at 5.4 respectively. i'll let you do the math on the realized numbers.
Enphase is a strong clean energy stock. and with data centres going clean and the news flash of nuclear power deals with the AMZN MSFT GOOG, people and Mr. Market is missing out on one good and important factor. Nuclear will take 5-8 years to kick in. till then it is wind and solar.
so, without boring you more, I would like to announce to TV and the followers of Foxx Invest that The Foxx has initiated a position in ENPH at 83.92 of 1800 stocks with a buy order for more 1000 at 73.0
Please do not take this as investment advice. this is me sharing my position.
Stick to value investing and if you have more than 2-3 lines (only trendlines) on your chart - you will take losses. Period !!!!!
Take care
Make money - thats the only thing that matters in life after health and family.
Foxx

Enphase Energy may push further downEnphase Energy (NASDAQ: ENPH) has built up a large top over the past years. This top already caused an impulsive first selloff. After a midterm distribution / range this selloff could enter a second phase in the upcoming few weeks.

1DTE short put for $ENPH -1 $104 put 10/4 1DTE short put for NASDAQ:ENPH
-1 $104 put 10/4
Opened on 10/3 for a $100 credit @ 2 PM EST
Happy to take assignment as NASDAQ:ENPH is exceedingly tradable, (great premiums, high volume, pretty consistently bouncing between $120 and $105). ENPH is a great stock for weekly and less than weekly short options (wheeling).

ENPH: Play the Channel or Wait for a BreakTaking a look at ENPH after it's epic run. Will it repeat the magic anytime soon?
This is a great company that's remained profitable in a tough business through high rates.
This Video highlights levels I am looking at. It's tough to imagine a ton of upside, but this company is legit. Just a question of earnings.
Not mentioned- aggressive moves in between the channel are very risky but can pay if you play at the extremes.

EPNH to 98-100$ area then go longThis stock will break it's Bollinger to the downside most likely tmmrw or Wednesday you will need to wait for it to get to 98-100$ area then buy a call for 2-3 weeks out to see the rewards I'll be keeping my eyes on it and also be putting if I enter the trade

(weeky option) ENPH perfect set up. Call- D1 shows a break-resistant line and has been retested.
- RSI is above 50 with a higher maRSI, indicating bullish momentum.
- The price is above the Ichimoku cloud on D1, also signaling bullishness.
EXPECTATION: The price is likely to rise this week. Consider taking profit when it reaches the red line on the chart, as I believe this stock could decline further, so secure profits when possible.

ENPH - needs to break $120ENPH - Stock rejecting 200 EMA at $120 . Stock forming a kind of rejection area for the stock rejecting it 3 times. Looking for calls above that level. for a move towards $150. Stock is strong on indicator level. puts below $112

ENPH could go either way soon: Clues to watch for nowBullish and bearish possibilities, but I'm a Buyer for a swing trade either way. Confluence of fibs and other clues should provide direction in the next few weeks, or sooner.
Near Term Bearish possibility : if price breaks $95.21 local low, confluence of support at $76-$78, and gap fill. Seasonality and possible Bearish Gartley formation support lower print before higher.
Near Term Bullish possibility : Should $95.21 low hold, a measured move prints around $181, which is also a 1.62 extension of the move up from $73 to $141, and a retest of Apr 2023 broken market structure.

Potential Bear Flag in EnphaseEnphase Energy has drifted sideways for almost a year, and some traders may think a long-term downtrend is resuming.
The first pattern on today’s chart is the drop after prices stalled at the December high near $140. That false breakout is a potentially bearish signal.
ENPH proceeded to slide below $100. It next bounced and retraced about half the decline, which may confirm its direction has turned lower.
Third, a series of lower highs since early July may be viewed as a bearish flag. The solar stock closed below the line on Friday. Has a breakdown begun?
Finally, several simple moving averages (SMAs) are more or less on top of each other. That compression, which results from the long period of sideways movement, could potentially give way to another period of volatility.
TradeStation has, for decades, advanced the trading industry, providing access to stocks, options and futures. See our Overview for more.
Past performance, whether actual or indicated by historical tests of strategies, is no guarantee of future performance or success. There is a possibility that you may sustain a loss equal to or greater than your entire investment regardless of which asset class you trade (equities, options or futures); therefore, you should not invest or risk money that you cannot afford to lose. Online trading is not suitable for all investors. View the document titled Characteristics and Risks of Standardized Options at www.TradeStation.com . Before trading any asset class, customers must read the relevant risk disclosure statements on www.TradeStation.com . System access and trade placement and execution may be delayed or fail due to market volatility and volume, quote delays, system and software errors, Internet traffic, outages and other factors.
Securities and futures trading is offered to self-directed customers by TradeStation Securities, Inc., a broker-dealer registered with the Securities and Exchange Commission and a futures commission merchant licensed with the Commodity Futures Trading Commission). TradeStation Securities is a member of the Financial Industry Regulatory Authority, the National Futures Association, and a number of exchanges.
TradeStation Securities, Inc. and TradeStation Technologies, Inc. are each wholly owned subsidiaries of TradeStation Group, Inc., both operating, and providing products and services, under the TradeStation brand and trademark. When applying for, or purchasing, accounts, subscriptions, products and services, it is important that you know which company you will be dealing with. Visit www.TradeStation.com for further important information explaining what this means.

ENPH Weekly/Monthly Analysis!1)I applied 2 moving averages on prices which have 5 period(red one) 20 period(green one) have cut each other and we got buy sign this week because we had to wait at the end of this week's closing candlestick on prices.
2) Also i have drawn resistance lines on prices and they have been broken this week with green candlestick. This is another buy sign.
3) RSI indicator has broken its resistance line this week and it will increase soon in my opinion. Also its 2 moving averages which are purple and green have cut each other.
4) Momentum has broken its resistance line this week. Also i applied SMA(8 period) on Momentum indicator. Momentum cut above its moving average and it is another buy sign.
5) MACD lost its strong down trend power as you saw. As i showed you on indicator, red bars are going sideways not going down showed us maybe reversal trend can occur.

ENPH Enphase Energy Options Ahead of EarningsIf you haven`t sold ENPH after the Double Dop:
Now analyzing the options chain and the chart patterns of ENPH Enphase Energy prior to the earnings report this week,
I would consider purchasing the 115usd strike price Calls with
an expiration date of 2024-7-26,
for a premium of approximately $3.40.
If these options prove to be profitable prior to the earnings release, I would sell at least half of them.

I was Right the Earning i should wait for it go down expect: 110-107
SL: 105
TP: 123
that for longterm i will daytrading when hit target when out whenever i feel enought

ENPHThis Weekly FORECAST
Opportunity for ENPH. This setup trading idea is for intraday. >> TAYOR
Risk Factors:
1. Market conditions, unexpected news, or external events could impact the trade.
2. Always use risk management strategies to protect your capital.

Enphase WholeSaleENPH has been in a stage 4 decline with the weekly chart showing an incredible accumulation sequence within the range of $72-$167… And after a stage 4 we roll back into a stage 1 and uptrend up to through stage 2 incline with stage 3 looking like a top of $226-$320 … Price is currently below the 200 EMA with signs of being undervalue or at its wholesale level.

Long $ENPH till day after earnings report July 24.There’s is a huge lift for all battery and renewable energy companies right.
For example, META hired Evercore EVR, to the tune of $54B to build out 11 square mile solar powered data storage facilities for its push into A.I., which requires a lot of energy to run AI.So there’s a ton of money from the large cap MAG 7 companies going into this industry right now.
Based on the volume profile and the fib levels already breached, i would easily believe if ENPH just slightly beats rev & earnings, and has decent guidance.

ENPH: The FINAL DecentENPH is in a strong decline and I don't believe earnings will do this stock any favors. I'm looking at a decline to $73 again and if earnings are overly poor, this stock will drop to $31 by this year or next.

ENPHAccumulating ENPH, assuming it will benefit from the lower interest rates (boosting sales as many customers purchases ENPH products on credit terms).
Some downside within a flat pattern highly likely, DCA is ok
NFA, of course

lets get rich babbbbby 1.1im thinking ENPH hitting some hor support, MACD curling up, could be a bottom.

ENPH DAILY CHARTDown move started at `339 and still going
Price at angle 495 which equal to 94.88
break down will take it to 80.10 rebound will pull it up to 110.91
Already symmetrical triangle support line had been broken (search for it)and so target will be at 72 .Let us wait and see

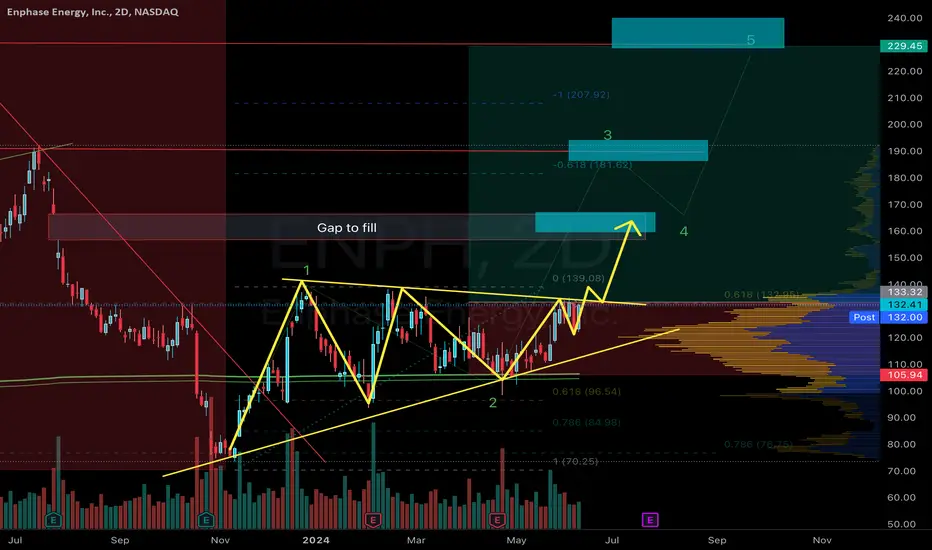
ENPH - compressed and ready for explosive move ENPH isn’t NVDA ;)
It took a while for it get consolidate and build some momentum.
It’s so tight here and we can see explosive move like FSLR
Target #1 160
Target #2 200
Target #3 230, after a while
Stop loss - 105