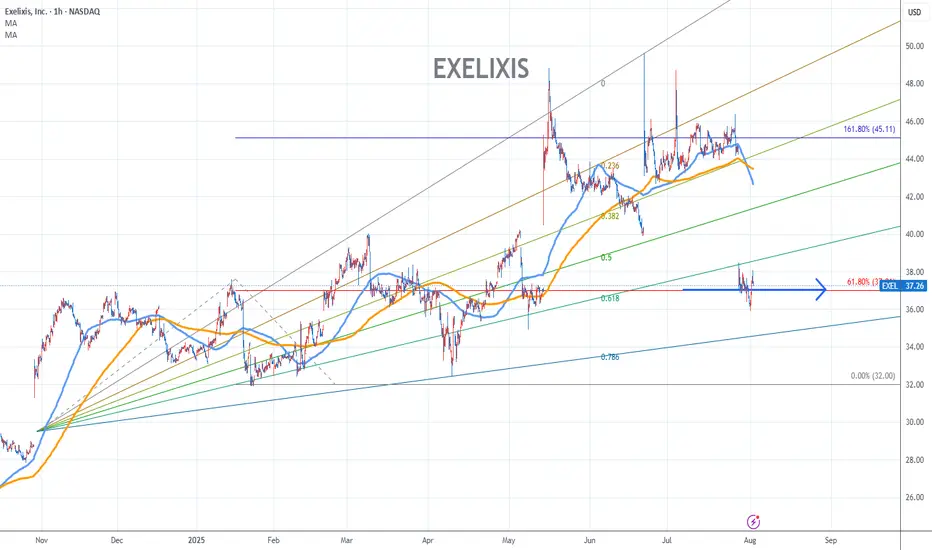
Exelixis Stock Chart Fibonacci Analysis 080125Exelixis Stock Chart Fibonacci Analysis 080125
Trading idea - Entry point > 37/61.80%
Trading Idea
1) Find a FIBO slingshot
2) Check FIBO 61.80% level
3) Entry Point > 37/61.80%
Chart time frame:B
A) 15 min(1W-3M)
B) 1 hr(3M-6M)
C) 4 hr(6M-1year)
D) 1 day(1-3years)
Stock progress:A
A) Keep ris
17,230.000
0.006 BRL
2.81 B BRL
11.69 B BRL
About Exelixis, Inc.
Sector
Industry
CEO
Michael M. Morrissey
Website
Headquarters
Alameda
Founded
1994
ISIN
BRE2XEBDR001
FIGI
BBG014XJH5R3
Exelixis, Inc. operates as an oncology company, which focuses on discovering, developing, and commercialization of new medicines for difficult-to-treat cancers. Its products include cabometyx, cometriq, and cotellic. The company was founded by Stelios Papadopoulos on November 15, 1994, and is headquartered in Alameda, CA.
Related stocks
Trading Journal $EXELHold really well over the market downturn, once it retook prior resistance, and closed above 50 MA, initiated buy position..
Went up ~7% before giving up all of its gains in one day. Exited position at the breach below 50 day MA

Trade Idea: Exelixis, Inc. (NASDAQ: EXEL)EXEL is offering a compelling setup, trading just above its 50-day moving average — a key technical level that has historically provided strong support. The stock belongs to a high-quality company with solid financials, reinforcing confidence in the broader trend.
With the price stabilizing above t

EXEL Chart Heating Up: Breakout Watch!🔍 Overview:
On the 30-minute chart of EXEL (Exelixis, Inc.), we're witnessing a symmetrical triangle breakout forming near a key confluence of support/resistance. This setup could lead to a potential bullish move if confirmed.
📌 Key Technical Highlights:
Pattern: Symmetrical triangle
Breakout Poin

Setup: EXELEXEL : I have a swing trade setup signal. I'm looking to enter long if the stock can manage to CLOSE above the last candle high(BUY). If triggered, I will then place a stop-loss below (SL) and a price target above it(TP= Sell all or 50%, move SL to breakeven), then using the close below the 10SMA as

Putting the odds in your favor - $EXEL in a green zone pullbackI've said before that trading with the trend is always something that improves your odds, both long and short. I don't ALWAYS trade with the trend but I like to, especially when there's other compelling reasons to. Putting the odds in your favor is always a smart move when trading.
On this chart

Exel This is the moment right here. My level I’ve been waiting for. Time
To long ?! This will be the third touch at same area we tapped and ran both times last time. Will history repeats ? I will take this chance stops below or cut upon closing candle below support. Good luck

Exel Patience here as we could retest lower support for the 3rd tap. Last 2 tests caused a sick rally. Will the 3rd tap do the same? Or will this support break as we now put in a lower high? I’d be watching 17$ if we hold and bounce, targeting half off at the downtrendinf resistance of the last 2 highs.

EXCEL - LongsProbably wont be in this until monday as want to see how markets will open.
XBI looking like a leading sector
EXCEL multiple daily closes above EMA cloud + Retest and push higher of 200EMA
HOWEVER - Missing volume on todays move higher.
2 TP marked on chart
Tight stop as always

EXEL LONGSAS PER THE CHART
3 suggested TP indicated
Very strong company - Positive EPS revisions
Biotech looking like it could be the next leading sector

See all ideas
Summarizing what the indicators are suggesting.
Oscillators
Neutral
SellBuy
Strong sellStrong buy
Strong sellSellNeutralBuyStrong buy
Oscillators
Neutral
SellBuy
Strong sellStrong buy
Strong sellSellNeutralBuyStrong buy
Summary
Neutral
SellBuy
Strong sellStrong buy
Strong sellSellNeutralBuyStrong buy
Summary
Neutral
SellBuy
Strong sellStrong buy
Strong sellSellNeutralBuyStrong buy
Summary
Neutral
SellBuy
Strong sellStrong buy
Strong sellSellNeutralBuyStrong buy
Moving Averages
Neutral
SellBuy
Strong sellStrong buy
Strong sellSellNeutralBuyStrong buy
Moving Averages
Neutral
SellBuy
Strong sellStrong buy
Strong sellSellNeutralBuyStrong buy
Displays a symbol's price movements over previous years to identify recurring trends.
Curated watchlists where E2XE34 is featured.
