Symmetrical TriangleEarnings 7-29 BMO.
Price appears to be in a horizontal trading channel but there is a protruding head like structure so I can not call it a true rectangle.
Looks as if analysts are bullish on earnings.
No recommendation.
EXXO34 trade ideas

ExxonMobil Corporation Up again$XOM is up with a gap above demand level of 89$, Showing strong momentum is a bear market.

Elliott Wave View: Exxon Mobil (XOM) Should See Further DownsideExxon Mobil (XOM) shows incomplete bearish sequence from 6.8.2022 high looking for further downside. The decline from 6.8.2022 high is unfolding as a zigzag Elliott Wave structure. Down from 6.8.2022 high, wave (A) ended at 83.52 and rally in wave (B) ended at 93.24. The stock has resumed lower and broken below wave (A) suggesting the next leg lower wave (C) has started. Down from wave (B), wave 1 ended at 81.01. Internal subdivision of wave 1 unfolded as a 5 waves impulse structure. Down from wave (B), wave ((i)) ended at 84.71 and rally in wave ((ii)) ended at 89.35. Stock resumes lower in wave ((iii)) towards 83.01, rally in wave ((iv)) ended at 85.87, and final leg lower wave ((v)) ended at 81.01 which completed wave 1.
Wave 2 rally is in progress to correct cycle from 6.28.2022 high in 3, 7, or 11 swing before it resumes lower. Internal of wave 2 is unfolding as a zigzag structure. Up from wave 1, wave ((a)) ended at 87.30 and pullback in wave ((b)) ended at 82.86. Wave ((c)) higher can see stock reaching 89.2 – 93.1 area to complete wave 2 before it resumes lower. As far as pivot at 93.26 high remains intact, expect rally to fail in 3, 7, or 11 swing for further downside.

XOM - "Oh the engine's gone dead," cried the men who work there Once the trendline breaks (and I think very soon) we should come back to retest it and then head down to the 70 dollar area by end of summer. This would create the potential for a larger head and shoulders pattern to play out into 2023.

XOM MACD trending favorablyXOM is trending between the 50 and 200 day MA, but the recent declines look to be trending favorably when looking at the MACD. Negative MACD is trending toward zero indicating the beginning of a reversal back to positive momentum.
Upward resistance at $90 and lower support at $75 which is increasing daily.
XOM priced at $65 Brent when physical market is tight, no scheduled increases in CapEx, and SPR releases working to keep pricing down.
XOM for the long haul, but anything under $83 or when Brent is in the $90’s
Upside target $135

$XOM short ideaXOM displaying a head & shoulders on the daily and has been showing relative weakness the last two weeks. Neckline is here at $84 with downside targets of 81, 78 and 74.
OptionsSwing Analyst
Daniel Betancourt

XOM - KC - 29062022Analysis
* Seeing a lot of consolidation patters before
* Obvious S&R lines to refer
* Market just dive after opening
* Assumed that it will make the same consolidation patterns
Plan
* Expiry = 9 days
* Hold = 1 day max
* Strategy = Naked Put
* E = 89.30
* TP = 88.12
* SL = 90.39 (wanted to reduce risk)
Journal
* TP = 87.72 (Changed plan because high volume before market closed)
* P/L = 53
* Trade according to plan = Not quite

Are energies done? XOM$XOM seems to be creating head and shoulders pattern. Imo the move for energies has been done, at least for a while. The previous support now acts like a resistance, and it failed to hold above 91.20 yesterday. I would be careful as it might be a change of trend and also could be wave 3 out of 5 on the way down. Still LT trend is bullish. We shall see if the 100MA will keep the price from falling lower.

Exxon Pulled Back. Now It’s BouncingEnergy, energy, energy: It’s been the manta of 2022, so let’s take a look at Exxon Mobil.
Earlier this month, the oil-and-gas giant hit triple digits for the first time in almost eight years. As noted at the time , prices were extended and a pulled back sharply. And now they’re bouncing.
The main pattern on this chart is the falling trendline along the highs during the slide. XOM closed above that resistance Monday and continued its rebound yesterday.
Next you have $89.49, a high in April 2019. It offered resistance again in February, but turned into support in May. Interestingly, this was almost exactly the stock’s bottom last week.
Third, prices rose after testing the 100-day simple moving average (SMA) for the first time since December. That may indicate the longer-term uptrend remains in effect.
Finally, notice how stochastics are turning up after hitting the most oversold condition since last August.
TradeStation has, for decades, advanced the trading industry, providing access to stocks, options, futures and cryptocurrencies. See our Overview for more.
Important Information
TradeStation Securities, Inc., TradeStation Crypto, Inc., and TradeStation Technologies, Inc. are each wholly owned subsidiaries of TradeStation Group, Inc., all operating, and providing products and services, under the TradeStation brand and trademark. You Can Trade, Inc. is also a wholly owned subsidiary of TradeStation Group, Inc., operating under its own brand and trademarks. TradeStation Crypto, Inc. offers to self-directed investors and traders cryptocurrency brokerage services. It is neither licensed with the SEC or the CFTC nor is it a Member of NFA. When applying for, or purchasing, accounts, subscriptions, products, and services, it is important that you know which company you will be dealing with. Please click here for further important information explaining what this means.
This content is for informational and educational purposes only. This is not a recommendation regarding any investment or investment strategy. Any opinions expressed herein are those of the author and do not represent the views or opinions of TradeStation or any of its affiliates.
Investing involves risks. Past performance, whether actual or indicated by historical tests of strategies, is no guarantee of future performance or success. There is a possibility that you may sustain a loss equal to or greater than your entire investment regardless of which asset class you trade (equities, options, futures, or digital assets); therefore, you should not invest or risk money that you cannot afford to lose. Before trading any asset class, first read the relevant risk disclosure statements on the Important Documents page, found here: www.tradestation.com .

Week 3 assignment (EXHIBIT A) for XOM by PROSHERIFFA Variation of Bullish Engulfing Pattern has been spotted on 1 hour chart. Take profit level is previous Lower High.

XOM ShortShort Entry: 90.81 as XOM Stalled and reversed after making a wedging rally into the peak of a potential right shoulder and also into the 50 day moving avg.
Stop: 93.30
Risk: 2.49 (2.75%)
Objective: 85.75
Reward: 5.06 (5.28%) 2

Exxxxxon telephoneYeah, this is looking an ABC as of now. can turn into a bigger WXY, but that means simply a better entry for us. Bring it on!

$XOM Analysis, Key levels & Targets$XOM Analysis, Key levels & Targets
By request… and thank you because I will play this one… Some of you know that I'm originally an energy sector trader... don't enter this trade unless you know the riskes... and have fun...
—-
I am not your financial advisor. Watch my setups first before you jump in… My trade set ups work very well and they are for my personal reference and if you decide to trade them you do so at your own risk. I will gladly answer questions to the best of my knowledge but ultimately the risk is on you. I will update targets as needed.
GL and happy trading.
IF you need anything analyzed Technically just comment with the Ticker and I’ll do it as soon as possible…
XOMOne the one hour 50EMA about to cross the 200EMA June 24th expiration on the options should pay out. Strikes sell set ATM and a tight buy to the sell, for a call credit spread. RSI is going stagnate at neutral levels. Under the cloud still bearish on the one hour, bc Jun24 expirations only need to look at the 1hr.
"Done for the day wife hope it works out"
-KewlKat

XOM - 50MA from support to resistance50 MA which acted as a previous strong support might now become a resistance. I'd be careful with energy stocks in the near term.


XOMGoing into next week we could see this push back to 100$. If this fails to break above 88 we will keep the downtrend to 70$

XOM Back to tunnelNYSE:XOM
Energy Sector get weak, CCI at top, Volume increasing.
TP at Fibs Points.

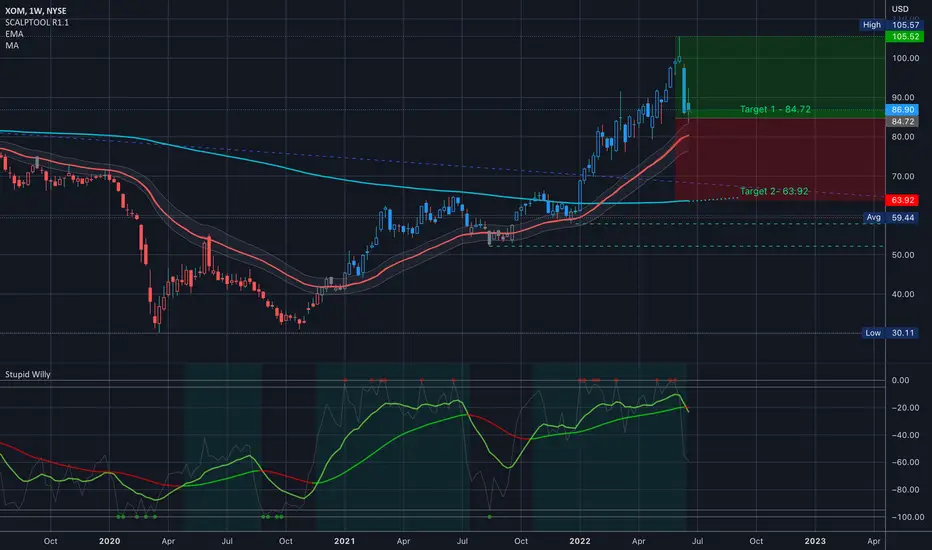
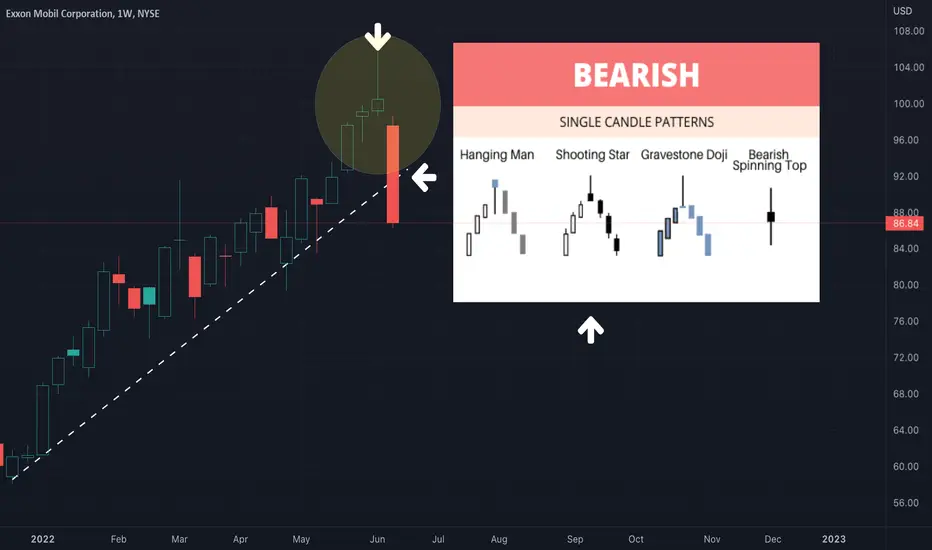
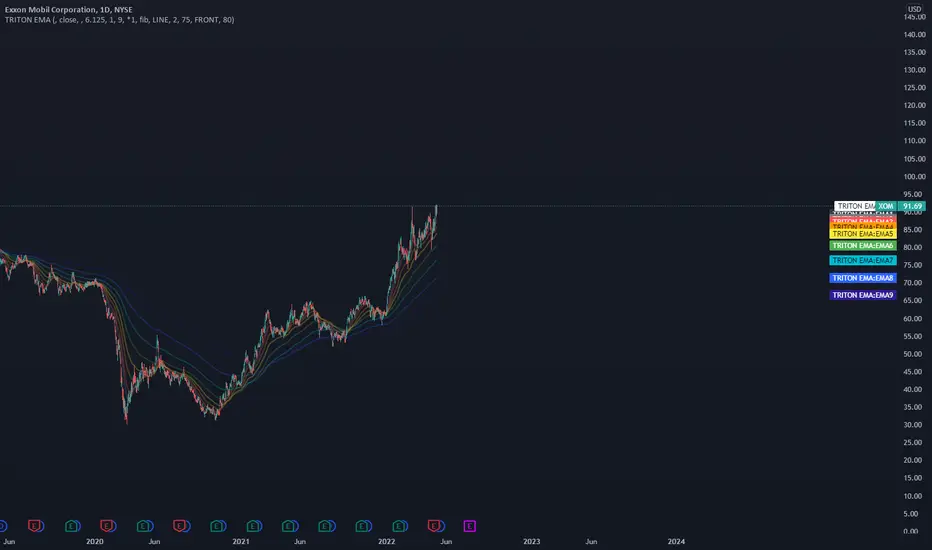
ExxonMobil Shooting Star PatternThe weekly candles for the oil and gas company, ExxonMobil, look quite bearish. This could be the start of a major decline. There is a shooting star pattern forming on the weekly chart, while the oscillators are trending down and while the daily EMA exp ribbon and daily trend lines breaking down. Although anything can happen, it is looking like a major bearish reversal is occurring. It's sad that just last week all the "expert analysts" at CNBC were making strong bullish calls about energy stocks, citing "free cash flow" and numerous other reasons to buy them, all the while the charts are showing a topping pattern in energy and commodities. This is usually when tops form - when there is no bearish sentiment among anyone, and when strong hands are selling to weak hands. At least charts do not lie, and thanks to @TradingView anyone can access them alongside a plethora of crowd-sourced scripts and indicators.
Exxonmobil perfect harmonicT1: 40
T2: 46
Despite the bad news and the chaos , despite the dump on US oil... the chart is telling us the light at the end of tunnel 💡
Divergence in the weekly and daily chart, smart money is accumulating

XOM - failed breakout - short XOM failed to break to ATH's. Everyone who can be is already long surely. Short it back down towards the trend line. Fairly tight stop above the attempt at new highs this week.

XOM Bull ExperimentMarket corrections are like x-rays. They allow you to see truly strong assets which were previously hidden by speculative bullish chaos. At a glance, the setup in XOM looks scary, but you need to trust the wisdom of the market. The trend is your friend, and the trend is up. Look around and ask yourself, who is benefitting the most from the current economic environment? Sometimes the right thing to do is the scary thing to do. Ride it until it starts showing signs of weakness. I have no target, but will monitor this over time and provide updates if I feel it's time to jump out.
XOM, Cup and Handle Break out ! Long above 92.05 !XOM is beautifully formed a classic cup and handle pattern.
So far, we have break out , pull back and only remaining point to safe entry is a bullish candle above 92.05.
First target which was obtained by adding the depth of cup ( shown as H on the chart ) to the break out line is 104-105 USD.
Please note the crude oil trend is also up therefore , it is reasonable for energy stocks to go up.
In terms of Elliott waves, XOM may see much higher prices especially in long terms . I will publish my broader view for the stock later and propose my wave count and related long term targets ( s.th close to 200 USD !! ). For now, I just tried to keep it as simple as possible.
Wish you nice profits.
