Energy stocks for high inflation era..!it seems Energy stocks are ready to finish their correction and started a new rally!
Keep them in your portfolio during high inflation times!
You can see the most important support (green lines) and resistance (red lines) to watch in the coming days in these charts!
Best,
Moshkelgosha
DISCLAIMER
I’m not a certified financial planner/advisor, a certified financial analyst, an economist, a CPA, an accountant, or a lawyer. I’m not a finance professional through formal education. The contents on this site are for informational purposes only and do not constitute financial, accounting, or legal advice. I can’t promise that the information shared on my posts is appropriate for you or anyone else. By using this site, you agree to hold me harmless from any ramifications, financial or otherwise, that occur to you as a result of acting on information found on this site.
EXXO34 trade ideas

Close your eyes and buy: XOMAt the start of the year with EV on everyone's lips I wanted to be contrarian. What is the sector that is MOST HATED in the market? Energy... specifically "dirty" energy. NYSE:XOM at the very start of the year was trading below Book Value. Through all of these price shocks to oil and a bearish energy market they have not ceased or cut their dividends. Even now at this price it still offers an above 7% yield. Unfortunately, I hesitated as now this week the bullish case seems to be known by all with new analyst upgrades coming out. I hate to do it but I started my long term position today. I'll add to my full allocation on (hopefully) pullbacks but sometimes you just have to buy the highs to get in.

Looking for a rally in Oil stocksThe market looks to be recovery today and the most interesting stocks to me were oil companies ( NYSE:XOM , NYSE:MRO , NYSE:COP ) which all exhibited morning open volatility spikes. The one I liked the most because it was at at 50% Retracement (see high timeframe below) is XOM so it fits my criteria for a long trade.
I'll be looking for a retest of the last major highs.
This is also an addon positions to a winner from the beginning of 2021 (see Related Idea).

XOM ISIN -US30231G1022 CUSIP 30231G102EXXONMOBIL is NYSE, with the common stock ownership of MECCA EXPRESS INC, holding the superseding schedule ! to date. OWNED by Garry Anthony WRight JR, yet this company is only owed by way of supporting financial baccking, by preforming fthe action for the SILVER & GOLD. Which was calculated by CME GROUP INC
XOM US30231G1022 30231G102

XOM resistance playXOM is testing a major resistance, and by the looks of premarket, we are pulling back slightly. My thoughts are a pullback before a break out over resistance. Look for resistance to act as support before making a trade. I'll be looking at calls if this happens. I likely won't be playing puts on this.

Guidance Looking for someone who can point me in the right direction on learning Pine. I've been trying to find some resources but nothing has really come out yet for V5.

XOM - Bump and Run ConfirmedXOM weekly shows Bmp and Run pattern confirmed. Good buy-and-hold opportunity here. Target $90

Xom Trade Opportunity There are several ways to play this, calls to play the breakout of the channel and stop loss would be under the trend line on the 3 month or puts for the rejection of the top of the channel and enter after the trend line on the 3 month breaks. Stop loss would be 65 or over the top of the channel

Go to the moonThe paper starts its upward movement, the fundamentals are good. A large buyback usually increases the value of the stock, oil is holding at a good level. Targets are marked on the chart. If resistance levels are broken through. Long-term trade.
❤️ If you find this helpful and want more FREE forecasts in TradingView
. . . . . Please show your support back,
. . . . . . . . Hit the 👍 LIKE button,
. . . . . . . . . . . Drop some feedback below in the comment!
❤️ Your Support is very much 🙏 appreciated!❤️
💎 Want us to help you become a better Stock trader?
Now, It's your turn!
Be sure to leave a comment let us know how do you see this opportunity and forecast.

XOM XOM may pop on earnings today. Oil and Gas, still a hot sector.
Not investment advice. Educational purposes only.

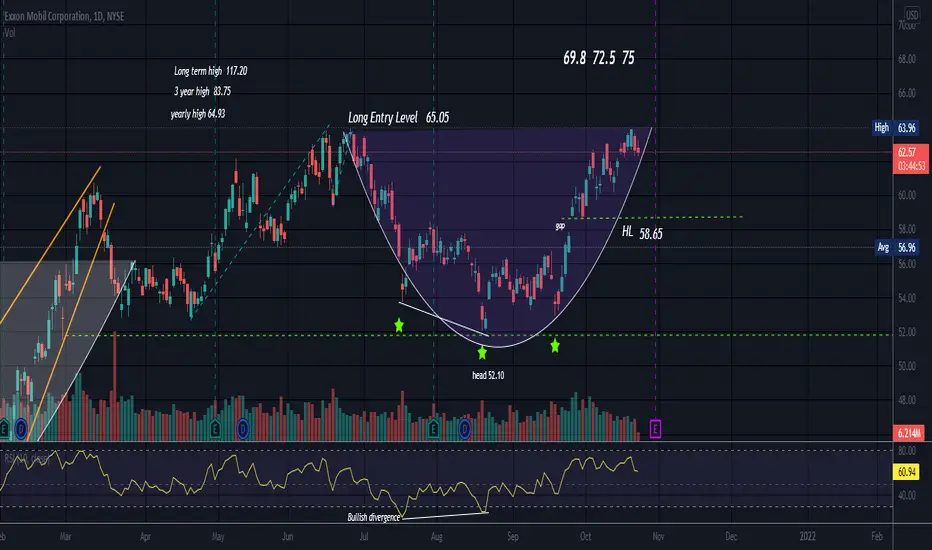
Cup and HandleAppears Oil is pulling back so I am watching a few. This is the one I own though.
This is a yearly cup and handle. If price breaks any longer term highs, then a new pattern could form. I suppose a lot depends on the cyclical environment that oil lives in.
Cup and handles are calculated using the cup depth. Subtract the cup low from left side (sell side) high and you can use this for calculating fib levels. Some, like me, use the .386, .618. and .786. You can also just multiply the depth by 0.39, 0.62 and 0.79 if you are not an exacto type personality (o: Add these levels to long entry level which would be a tad above the left side high to clear resistance. I often use 10 to 15 cents above the left side high, unless it is a super expensive or a very volatile stock. This was an inverse head and shoulders earlier so the head of that pattern is the cup low.
There was a bullish divergence near cup low which has probably realized it's gain at this point.
This may pull back a bit more.
No recommendation.
True patience is a virtue that few posses when it comes to their wallet. Sometimes sitting on your hands pays off (o:
XOM: Correction incoming!We saw XOM gone up since my previous analysis but now it's forming an ascending wedge and might come down a little. The MACD and RSI also support this to some extend. Could it go a little higher before the drop? sure but the target is there. Check it out.

Best Oil related stocks in the past 50 days..!This article compares the performance of Oil-related stocks, which shows Occidental, ConocoPhillips, and Valero outperform others..!
Higher oil prices will push prices higher in the next 3-6 months.

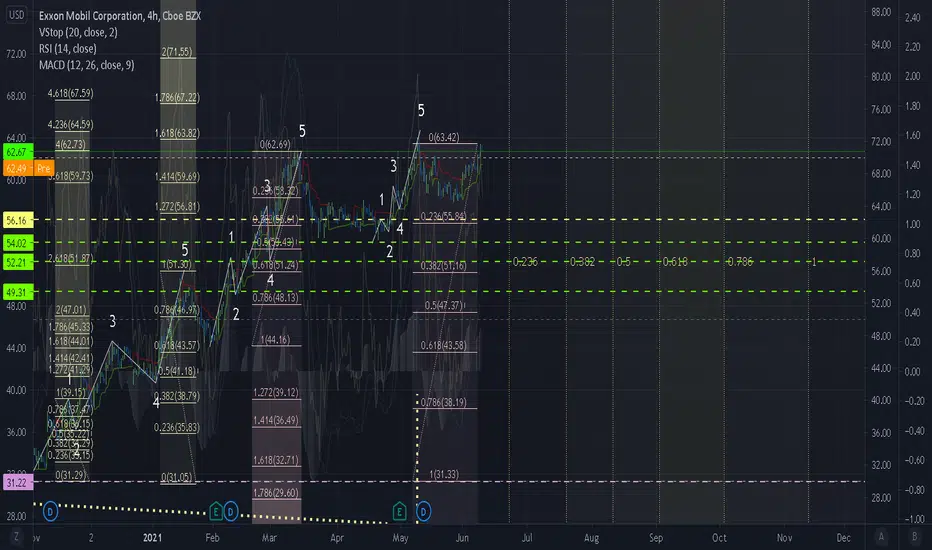
A Great Long? Or More Downside?This could be completion of wave 1-2 which would in theory mean we're at the start of a new uptrend (Wave 3) which would last for quite some time and see prices making new highs.

EOY Estimate for XOM based on Multi-Year Fibonacci RetracementsThis is my EOY estimate for XOM as it follows a strong retracement along the fibonacci measurements. Look for a new high for XOM by the end of the year.

Weekly Cup and HandleXOM has broken out of a daily cup and handle pattern (white cup) but is not close to long entry level for the longer term weekly cup and handle (Purple).
The handle low is virtually the same for both cups. There is a bullish crossover of the 20 through the 50 on daily which can not be seen on this chart as it is a weekly chart.
XOM has had some issues with rising wedges a long the way. There was also a bearish divergence on weekly at the same time price reached the top of the rising wedge marked with orange trendlines inside of cup. Hopefully price has fallen enough to correct the divergence. When a divergence shows up on weekly, it is most likely a true divergence. Bearish divergences are usually drawn using the price peaks and bullish divergences are drawn using price valleys.
Anyway I listed the shorter term daily cup targets and also the weekly cup targets which depend on price reaching long entry level of 73.22. Long term high is 117.20.
As we know oil is volatile, and a news broadcast can send it soaring or diving.
Negative volume had dipped but is back up. Short interest is extremely low. Possible Inverse Head and Shoulders recently on daily and head is 52.10. Neckline 61.04. Price is right at neckline with a Bullish Marubozu candle (Shaven head and shaven bottom) noted
Inverse head and shoulders patterns are not valid unless neckline is broken with a trend in that direction. I will try to post the daily chart under this one.
Apologize for the busy chart if it causes info overload )o:
No recommendation

XOM inverse cup and handle Seems to me, at this time, pretty much any larger holdings in the S&P are safe to buy an in the money or out of the money put contract(s). We are seeing a controlled correction instead of a complete dump. I am no financial advisor or analyst. XOM is one of my favorites to either support, or short. I am seeing a rather large cup and handle formation brewing here which should give is a definite answer to how close , or amount of correction we may see in the next few days. Good luck out there Guys and Gals.

Exxon-Mobil Corp. (XOM)The pickup up in oil quotations this year is lifting profits nicely and we believe that this trend can continue throughout the next year. Strong demand in the chemicals division and a lower cost structure are also helping performance.
The high dividend yield likely indicates concerns about oil demand and the push for electric vehicles over the very long term. That changeover may take many years, but we believe this "green" transition could bring much more benefits to the price of crude oil.
Total profit estimated for fy 2021: 16.2 bil.
Total debt: 45.0 bil.

Exxon Mobil at the end of Impulse? XOMThe picture is not 100% clear, but we are query if this might be it for XOM. It is possible at this stage to have a relatively shallow pullback, to only start rising again. At this stage, it is looking quite likely that we might be meandering locally for a period of time. Markets cannot be timed.
Remember that this is not financial advice and that we are not responsible for your portfolio. Only you are. You must do your own research and remember to act in accordance to your own research. That aside, Fibonacci goals are as ever in green and invalidation is in red. Take care of yourselves out there.
GANN THEORY Strategize I know that some people out want a Easier Approach when trading stocks. Please understand i am not a License Professional trader, been trading since i graduated from high school 14 years ago. Wanted to show a brief way to trade the GANN theory that i have posted before this. How to set up the GANN is outline in it, if you need help please message me.
Everything i do is anchor(i have allot of MTF items on my chart) (( all have to set to the desired result)) on the Upper time frame based on what my goal is.... Am i going to Day-trade this , am i going to Swing this ?
so my recommendations is ANCHORS DAILY WEEKLY AND MONTHLY for GANN...
15min 5min dual chart for Daily GANN anchor.
4hr and 1hr dual chart for Weekly
1day solo chart for Monthly
Having 2 different charts = more trade opportunities to Aim at so i recommend that on the daily and the Weekly time frames.
When set up correctly trading is simple, sometimes automated but you still need to pay attention to the charts, i am not saying this is the HOLY GRAIL... i am sure it adapt and improve overtime but i have had great success with it.

Double bottom at ExxonMobil Corp.On the weekly chart, Exxon Mobile drew a double bottom. In fact, there has already been a takeout and now the price is fixed about the "middle" of W.
The simplest idea is to reach a local maximum of 64.7 (15.6%). The
next goal is 86 (53%).

Ready to take off?!The short answer is yes.
The longer one is a bit more complicated...
In my opinion, the chart looks extremely bullish.
We had a nice break-out and a retest.
At the moment: the price sits at a very important resistance, and between the 2 most important EMAs.
If we can reclaim the 50 EMA, then we will have a nice run-up.
However pay close attention to the volume, because it needs to be high when breaking out!

XOM Daily TimeframeSNIPER STRATEGY (new version)
It works ALMOST ON ANY CHART.
It produces Weak, Medium and Strong signals based on consisting elements.
NOT ALL TARGETS CAN BE ACHIEVED, let's make that clear.
TARGETS OR ENTRY PRICES ARE STRONG SUPPORT AND RESISTANCE LEVELS.
ENTRY PRICE BLACK COLOR
TARGETS GREEN COLOR
STOP LOSS RED COLOR
DO NOT USE THIS STROTEGY FOR LEVERAGED TRADING.
It will not give you the whole wave like any other strategy out there but it will give you a huge part of the wave.
The BEST TIMEFRAMES for this strategy are Daily, Weekly and Monthly however it can work on any timeframe.
Consider those points and you will have a huge advantage in the market.
There is a lot more about this strategy.
It can predict possible target and also give you almost exact buy or sell time on the spot.
I am developing it even more so stay tuned and start to follow me for more signals and forecasts.
START BELIEVING AND GOOD LUCK
HADIMOZAYAN
