FSLY growth name bottomed, breakout coming?Growth names are hard to predict right now but SNOW did start a nice reversal lately. Could others start to follow? Looking at June calls from 45-50 rang to try to catch this move. Some volume above this demand shelf could send it into this gap. Over 48 and it could explode. Being in now will allow some rolls to higher longer dated calls to catch that move with less risk.
F1SL34 trade ideas

Perhaps Time To Load Up On FastlyBased on the current Elliott Wave analysis on Fastly (NYSE:FSLY), I are seeing an strong confluence for a rebound around the $25-$35 region.
EW market structure seems to indicate that the larger WXY correction where the Y-Leg is made up of an ABC Zig Zag is coming close to completion, pending the last 5th wave drop of the smaller degree.
This also coincides with the Fibonacci Confluence of both the Fibo Retracement zone of 78.6% to 88.6% ( Harmonic Gartley or Bat ) as well as the Fibo Extension zone of 100% to 138.2%.
Both are high possibility inflexion zones where prices are likely to make a "U" turn.
If investors still believe in Fastly's growth trajectory, accept the shock loss of their CFO and can look beyond the short term setback where the edge-computing specialist came up slightly short of estimates in its first-quarter earnings report, then the prognosis going forward will be an rebound rally that could double to triple your investments.

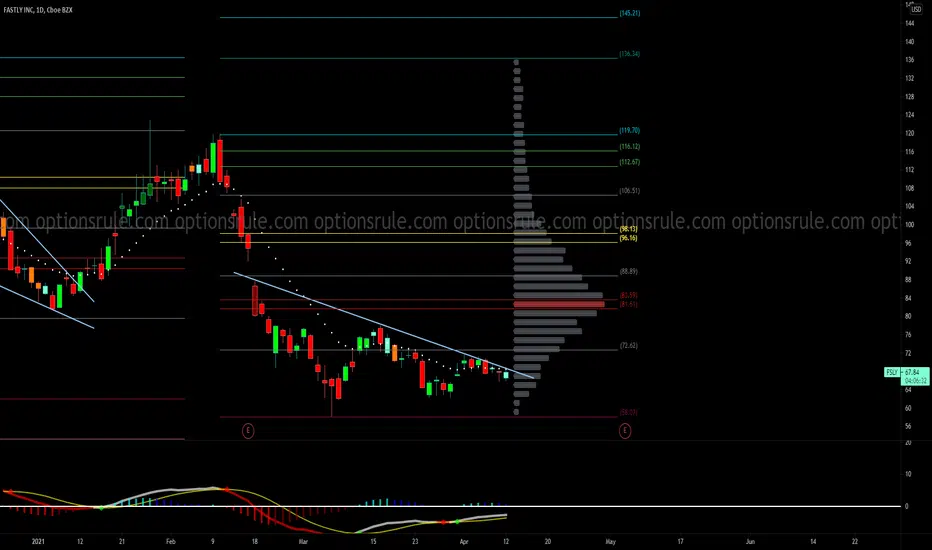
FSLY BounceFSLY has reached a support zone where a bounce is likely. A bounce up to the 48 zone would be where the earnings release price gapped down to, which will act as resistance until the gap is filled.

FSLY (TIME FOR CALL OPTIONS)FSLY IS forming what look to be a Regular flat Elliott correction wave (abc). C broke the previous low A, thats a signal that the pattern is nearing completion all thats left to do is look for a lower degree correction on either the 5 min or 1 min chart. I've got my eye on FSLY 17th Sep $55.00 Call and
17th Sep $65.00 Call.


FSLY that should be the bottom or CloseBeautiful B pullback to the .764 Fib, possible it drops to $35 but this is the area you want to get in. Big trendline and FIB support, you could scale in, buy low sell high! The crowd hates it now, that's a good thing.


FSLY Triple Bottom - Don't Play ER, but recent catalysts nice!FSLY seeing a triple bottom here and a squeeze going into ER this week. There recent catalysts are great news and I love this stock long term. I expect guidance to be good given their recent PR's. Let's see if ER leads us back to ATH's.

Can FSLY impress the investorsThis has gone dark for many weeks with its sharp corrections. I see some accomulation happening at these level's and any good news in next few days can trigger the upswing


BTO $FSLY 20210521 $80 call at $3.65 for practiceAs shown by my other posts, I usually do call leaps > 1 year. But this time I a opening a 20210521 $80 call at $3.65 for practice.
Reasons for this action:
1. tight BB width .
2. price stay above 10/20 SMA . Today is the second day.
I will STC if the price goes to $77 in a very fast manner. But if the price raise slow and steady, I expect it to reach the $90 ga

Symmetrical TrianglePrice can break up or down from any type of triangle.
Triangles are consolidation patterns, but sometimes continuation patterns of the prior trend.
Price came down to enter this triangle so some place"1" at the bottom of the triangle and if price came Up in to the formation, they place the 1 at the top trendine indicating the 1st touch.
No recommendation
One way of estimating targets is to draw a line at the wide end and project it in the direction of the breakout.

FASTLY being trickyAs a long share holder I have been adding heavily under $100 per share. As far as wave count, the count here is possible, but price action makes me believe wave 2 isn't over and we make one more lower low before the huge upside in wave 3. If we break 59 then we likely see 48. Down is good, up is good, as I'm going to add heavily as long as we are under $100 per share. This is an opportunity to accumulate shares.

$FSLY Cypher Pattern Building higher lows, getting tight at 886 trigger, has a weekly wick violation i noted it, also noted take profit levels, get long over Fridays high and let this run to Wed-Thurs, Friday latest, stop to break even asap, Pre market best here IMO to get long

FSLY - looking for a break out soonWatching closely if it breaks 69.8 level TG 1 will be 77 TG 2 will be 80 which will confirm ABCD pattern

$FSLY - looks ready! Targeting red zone in short term. Meanwhile I am open to entertaining a buyout scenario. :)
FLSY 🌦I'm waiting for the fractal completion on the lower time frame (yellow arrow). Only then will I engage with call options for three month expiries.

FSLY looks like it wants more $FSLY with a big bounce off hidden trend.
- Cleared & closed above the 20 SMA
- Clear of the 8 EMA, Closed at the 21 EMA
- 5SMA about to cross the 10SMA
Like this to challenge 78.50ish near future.

FSLY 🌦➡️Pattern recognized:
Regular flat ECW
➡️Hypothesis:
Bullish
➡️Inter-market analysis:
➡️Catalyst:
Earnings in 40 days
➡️Conclusion:
Waiting on the completion of the fractal on lower time frame.
***This does not constitute financial advice.***
If you like what you see why not support us?
👇

FSLY SwingConfirmations:
Low RSI
Strong weekly yearly demand zone
Bottom of ABC wave formation
Golden fib zone 61%

FSLY LongSideway Consolidation in uptrend
Near bottom
Breakaway Gap,
Possible double bottom
Entry 68
Stop 58
Target 120
I am not a PRO trader. I trade option to test my trading plan with small cost.
The max Risk of each plan is less than 1% of my account.
If you like this idea, please use SIM/Demo account to try it.
