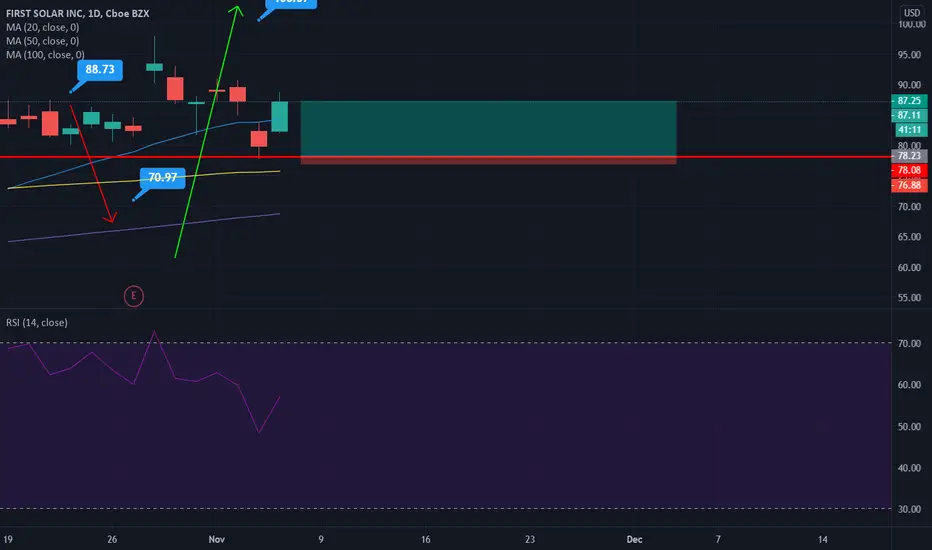
FSLR on watchWorking its way to new highs. Long above the box to dotted line targets. Risk is a close below box.
FSLR34 trade ideas

FSLR Long StratLiking FSLR's mission, esp w Biden this company has potential. It seems to be strongly holding the levels plotted - January calls could work above 90.70 or on a bounce of the 86.45 level


$FSLR Biden playFSLR long @ $82
Short term target: $92.37
2021 target: $139
Stop: $78.5 (50% retrace)
Support: $73.95 (61.8% retrace)
In some $85 call weekly lottos for .50

First Solar.w46. Long after deep correction. 75 to 100$Monthly
Possible breakout from rectangle formation.
Need to be retested and then long.
Bullish Gartley formation
Weekly
Uptrend
Strong sells reaction
Daily
Seems like breakout retested.
Wait for confirmation that correction ended and open LONG
Open 75
SL 70
TP1 100 RR 4
TP2 110 RR 6

FSLR - Elliott wave analysis - Bear case FSLR - It is in C wave down in flat correction after impulse cycle over in 4 hr time frame. The ABC flat is in 30 min time frame. Wait for 2nd subwave bounce to get in to trade for 3rd subwave down with stop level above 95.60.
Give thumbs up if you really like the trade idea.

FSLR: Technicals Not So Bright For This Solar StockChecking FSLR we can immediately see a warning signal from our CDV indicator at the bottom of the chart. Since Oct 7th, we've been on a down trend indicating the bulls are really losing momentum and the bears may be ready to feast. This is a bit of surprise since they had a big earnings beat only two weeks ago.
On top of our CDV divergence it looks like we also have a possible head and shoulders pattern inside of our broadening wedge. If you view the 30-minute chart the head and shoulders becomes a bit more clear.
To me this chart looks technically bearish but considering their recent earnings report & a biden presidency, this stock does have catalysts go up.
If the bulls aren't able to step in and keep control of the current trendline, we may find support between 76.50 and 80. That would be an important trendline the bulls cannot lose.
NASDAQ:FSLR

Long FSLR??????looking at this chart this thing looks like its ready to take off. with biden being our new president, energy and renewables and tech are the sectors to look into. so are we looking at a new bull run for FSLR? considering the futures are bright and green we may be looking at a good stock to grab leaps on!!!!!

Cup and Handle Rising wedge Earnings AMCEarnings today after market close
Possible rising wedge pattern that has formed so be safe/RWs are often bearish
Risky to trade close to earnings due to market reponse. FSLR could beat earnings and still go down, or miss and go up! Just depends on market response
Bad wekk to buy a lot of thisng with uncertainth at a high. The market doesn't care for the unknown
FSLR has pierced bottom trendline of rising wedge pattern
Some stocks do not fall much more than that, others do
NV is high as is obv
Just a tough week
Not a recommendation

$FSLR First Solar Earnings trade High R/R.
One of the hottest stocks of 2020 , part of a sector rallying on
the hopes of a Biden Election win.
Major resistance sits $85.23 pivot point, a break above that opens up the
chart for a rally to $95.00.
This is a risky hold into earnings but rewarding is we get a positive move.

Long wait Peek-a-boo break up! 2 days to ERSmall pos for a little observation. We need S$P500 (S&P) to give some direction ! XD


First Solar, Inc Stock Ready for Growth !Trade Analysis based on Fundamentals and Price Action.
With Risk management you Will Never Loss.
Thank You.


Deal ✓152 - IPO Array - solar powered +$ 5,000 per day!Stock market. Stocks. IPO Array Technologies (ARRY) — on October 14, 2020, the IPO of Array Technologies will take place. The company is one of the world's largest manufacturers of ground — mounted systems for solar energy projects-solar trackers. The placement is underwritten by Goldman Sachs, JPMorgan, Guggenheim Securities and Morgan Stanley. The deadline for submitting an order with the broker is until 20-00 Moscow time on 13.10.2020, the start date of trading is 15.10.2020.
2% of the Fund will be invested in shares of this company. A detailed report on the transaction, or "opportunity card", for all partners of our Fund will be provided in PDF format. Anyone who wants to get more information, please write in private messages.
Keywords: IPO, opportunity, insider, profit

FSLR Support and Resistance- WatchlistNASDAQ:FSLR is a leader in the solar industry which will likely become a leading industry. I like this stock to begin pulling back after having a great start to the month. After this consolidation (watch for a bounce off 75.73) I believe that the upside is great. Break in 81.85 would likely lead to a test of 87.89. Earnings will play a big role in this and a beat or an upgrade could lift this stock greatly. Not seeing any outstanding patterns on the chart and most indicators are showing a downside.


FSLR Ichimoku Clouds entry LONGAssuming we close above the cloud (almost certain) then today is a perfect entry to catch a 2-3% pop over the next day or two. On FSLR, this entry strategy has historically yielded a win 69% of the time with an average value of 2.73%.

$FSLR First Solar Breakout Targets $100?
FSLR on verge of yet another bullish breakout with strong momentum and volume.
Alert set for break above $82.00
targets as per Horizontal resistance levels and Fibonacci
expansions.

$FSLR First Solar Breakout Trade
Potential long above $84.00 dependent on volume
Upside target $98.00

FIRST SOLAR Strategy DailyHey people, FIRST SOLAR is in a fake bearish movement and large purchase volume issued and an ongoing bear shadow. On the TIMEFRAME 1Min we see a doji with a sales volume and a bull wick. Who goes on his last next point then start again on his climb and break the VWAP. Big possibility of returning to the next highest and coming to the next high. See the TIMEFRAME 4H then move towards a resistance of 2011, to break a long term range.
Please LIKE & FOLLOW, thank you!
