FSLR on watchFSLR currently at a long term resistance. Looking for this company to become a leader on a breakout, but SPY still has to cooperate to really let these bulls get going. Volume confirmation would also be nice.
FSLR34 trade ideas

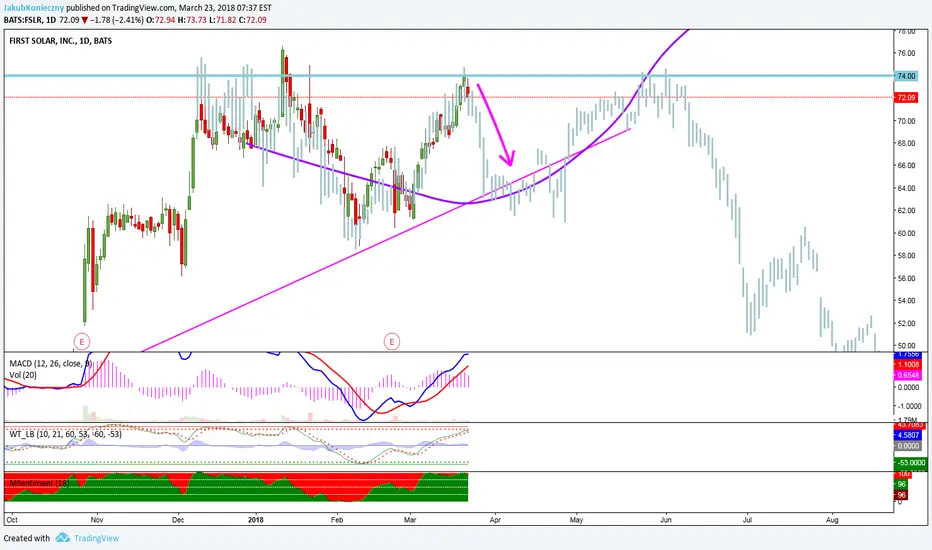
FSLR LongBullish looking weekly chart with a bunch of cups and the 73-75 resistance level tested several times.
Looking for a break of that level soon and follow through to 95-100 target level.
Once breaksout, stop below 72.
This could be a multi-week or multi-month swing play.
Weekly moving averages in bullish configuration as well.

FLSR approaching a critical pointDear reader,
Do not trust me. I am a beginner in terms of performance and veteran in terms of experience. The market does not care about the latter remember that always.
This is my analysis for FSLR a stock I have traded successfully and unsuccessfully in the past.
Where are we standing?
Longer timeframe:
- Inside a wide multi-week box starting early December 2017 consolidating the 50 point run from the lows.
- Current price action is at approaching resistance.
Shorter timeframe:
- Stock acting strong after a 1-week small consolidation in early March.
Even longer timeframe (monthly):
- We sit in front of volume pocket from the calamitous 2011 fall. 112 should be the longer timeframe target for a future move.
Where are we heading:
Scenario 1:
- Rejection of multi-year resistance and we go back to trade inside the box or consolidate around the current level. (red line / weekly timeframe)
Scenario 2:
- Continuation previous to consolidation at the 75-76 level. 2018 highs. (orange horizontal line / daily timeframe))
Scenario 3:
- This is where things get interesting and for this, you need the monthly chart as the next point of resistance will be 112.12 YES, 37 points above of the current price action. (purple line / monthly timeframe)
I admit Scenario 3 is short-term is a bit wishful thinking yet worth keeping in mind as possible.
How to trade it:
- If you have traded this from within the box adjust your stops accordingly closer to the top of the box.
- In the longer timeframe leaps could be potentially interesting with the bigger goal in mind.
Thanks for reading. Views are my own.

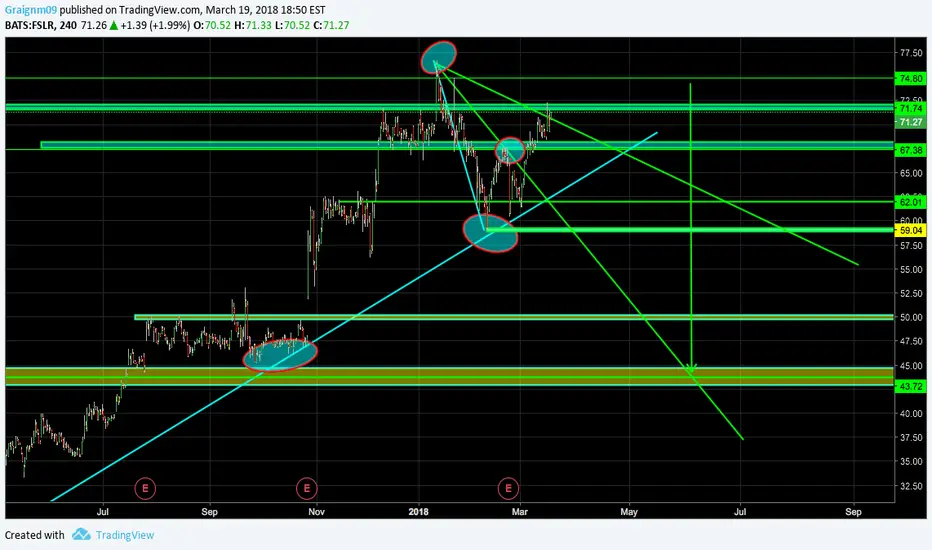
FSLR approaching a critical pointDear reader,
Do not trust me. I am a beginner in terms of performance and veteran in terms of experience. The market does not care about the latter remember that always.
This is my analysis for FSLR a stock I have traded successfully and unsuccessfully in the past.
Where are we standing?
Longer timeframe:
- Inside a wide multi-week box starting early December 2017 consolidating the 50 point run from the lows.
- Current price action is at approaching resistance.
Shorter timeframe:
- Stock acting strong after a 1-week small consolidation in early March.
Even longer timeframe (monthly):
- We sit in front of volume pocket from the calamitous 2011 fall. 112 should be the longer timeframe target for a future move.
Where are we heading:
Scenario 1:
- Rejection of multi-year resistance and we go back to trade inside the box or consolidate around the current level. (red line / weekly timeframe)
Scenario 2:
- Continuation previous to consolidation at the 75-76 level. 2018 highs. (orange horizontal line / daily timeframe))
Scenario 3:
- This is where things get interesting and for this, you need the monthly chart as the next point of resistance will be 112.12 YES, 37 points above of the current price action. (purple line / monthly timeframe)
I admit Scenario 3 is short-term is a bit wishful thinking yet worth keeping in mind as possible.
How to trade it:
- If you have traded this from within the box adjust your stops accordingly closer to the top of the box.
- In the longer timeframe leaps could be potentially interesting with the bigger goal in mind.
Thanks for reading. Views are my own.

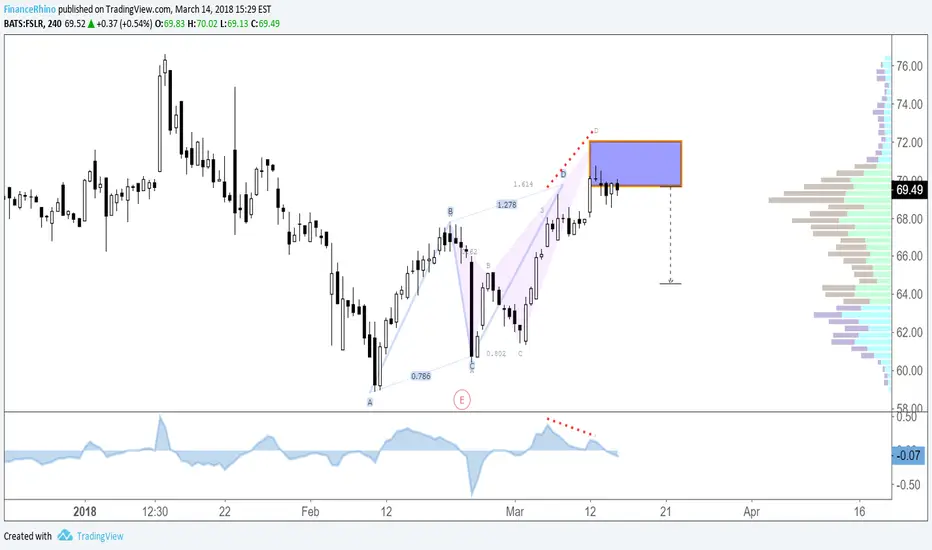
Bearish BatBearish Bat with bearish divergence. For some reason I always get burned on FSLR... but I think it will a success this time!
Measurements
- .886XA
- 2.24BC
- 1.27AB=CD


SHORT ON FIRST SOLAR!Short going once, going twice and let's sell...
Here we have it, as you can see my previous call on this didn't go in my favour at all in fact it went to the upside taking out current highs. This time it's sell time. I believe that we may be in for a real treat and prices may decline at 72.00 or go to the upside and reverse near the 76.00 Region taking out lows of 65.00/50.00
Let's Wait And See!
TP: 65.00/50.00
Bearish Crab & Bearish AB=CDAB=CD & Bearish Crab with bearish divergence. Both patterns converge within the same potential reversal zone and momentum is starting to shift to the downside.


FSLR - Watch itAs of now FSLR is right above support zone. I would stay away from it for short term. I think Trump's tariff on Solar Panel imports doesn't help it. Before Trump imposed tariffs on Solar Panel imports...imports have surged and there is an estimated 6 month supply in storage. So...I don't see a big business for another 6 months.
Also...a few groups in Solar Industry are concerned that Tariffs would increase Solar Panel prices and hinder solar industry growth in the USA.
Disclaimer: This is just my opinion, not an advice. Trade at your own risk. I/We short FSLR.

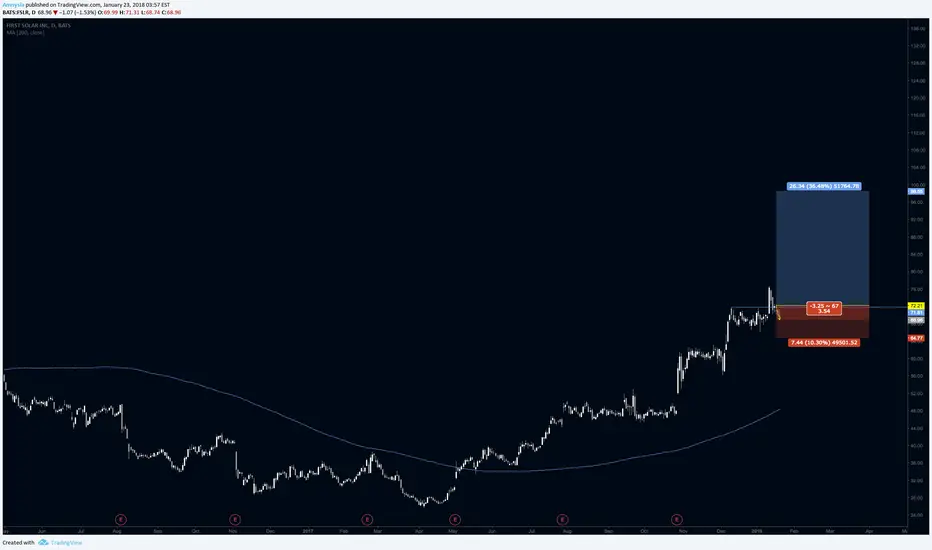
FIRST SOLAR INC.A Short On First Solar Inc?
I'm awaiting several things which may ultimately give me the green light.
If prices breakthrough the 62.00 Level you can expect prices to possibly break the trend line.
However
I'm waiting for a breakthrough the trend line which could then potentially wipe out prior lower lows.
I would get in when prices are approaching the trend line, with significant volume to ride the trend down to the 50.00 Level.
Sector: Energy. Renewable Energy
Volume: 2.345M
EPS: -4.14
Market Cap: 6.966B
TP: 50.00

Bullish pattern for FSLRWatch NASDAQ:FSLR , Bullish MACD and RSI.
Main Resistance @75$
Main support @39.09$
Watch out from close earnings.

C&H / IHS on $FSLR - not confirmedER this year can take it over the multi year pivot 74.5 breakout will confirm and move it up 40-50pts (or over 100). Trend reversal a year ago


Long term for First Solar Inc. - the time of 'solar action'Long-term First Solar Inc. - the time of 'solar action'
First Solar, Inc. is a provider of photovoltaic (PV) solar energy solutions. The Company designs, manufactures and sells PV solar modules with thin-film semiconductor technology, and also develops, designs, constructs and sells PV solar power solutions. The Company operates through two segments: components and systems. The Company's components segment designs, manufactures and sells solar modules, which convert sunlight into electricity. The Company's systems segment provides PV solar power systems or solar solutions for systems, which use the Company's solar modules. The Company provides operations and maintenance (O&M) services to plant owners that use solar modules manufactured by the Company or by other third-party manufacturers. The Company has approximately 30 manufacturing lines around the world and over 2.8 gigawatts (GW) of annual manufacturing capacity with lines having a production capability of approximately 2,500 modules per day.
www.google.com


First Solar Inc (FSLR) Possible bull flag. Watching to see if it breaks out of flag. If so, it could see 82.80.
