First Solar Daily. Failed Bull Flag, completed Bear FlagAfter ER @53.00 p-m, this is a mess tgt 40.00(ish)
FSLR34 trade ideas

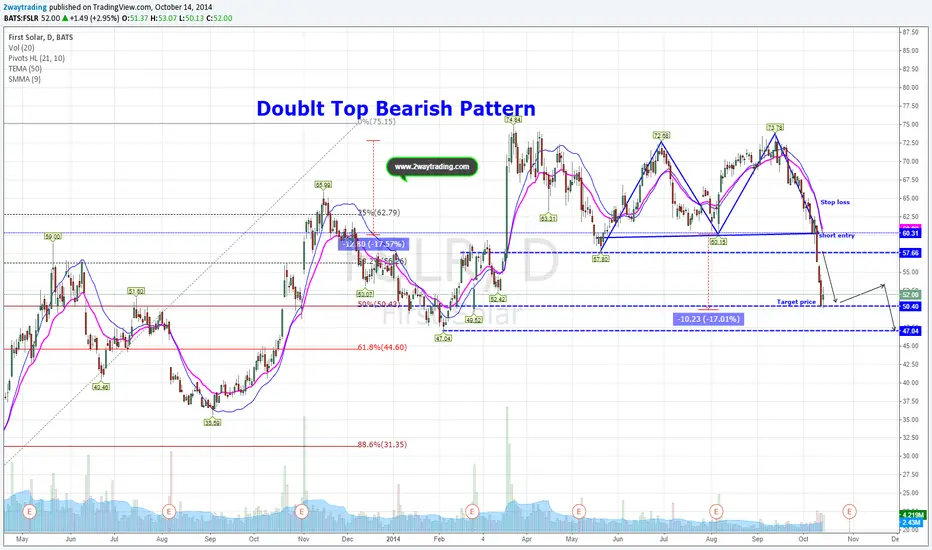
No Support before $50 but will it hold? Not likelyRecent sell off from Sept high had a brief rest, and will soon continue. Anyone who reads today's earning transcript will add short from here. No support before $50 and probably will not hold but 3rd downside leg could resume from there with target price at 47.04 before the end of the year. If you want a real time alert try us www.2waytrading.com


Follow Up Previous Post 4-days ago, we commented this classic double top bearish with precise projected price target and it hit, and bounced as expected per the note. Now, there is no good reason to go long til price penetrates upper neckline with a solid volume that seems unlikely in the near future, should stay at this level to lower prices. Next good area for a possible bounce will be 47. If you want to get a real time alerts try us www.2waytrading.com
$FSLR Don't try and pick a bottom...Just wait for the market$FSLR Don't try and pick a bottom...Just wait for the market support.

Classic Double Top Bearish PatternIt has a measured price target at 50-49 area. If you decide to take a bearish bet make your stop loss at recent swing high with target price 49 area. If you need a real time alerts try us www.2waytrading.com

A Sunny Level For First Solar, Inc. (NASDAQ:FSLR)In the last few weeks we have seen the markets roll over. It has taken down many stocks and many sectors and First Solar, Inc. (NASDAQ:FSLR) is no exception. The stock is down almost 20% from its high pivot on September 12 of $73.78. The stock of First Solar, Inc. (NASDAQ:FSLR) is starting to get into good levels of support, and now is the time when traders need to step up and get long this equity. The great support level which I am zeroing in on is $57.75. That is where First Solar should see mass buyers coming in, giving the stock a nice pop in price. Keep this stock on your radar and profit.
If you only read one email again, make sure it comes from the Elite Round Table. Our FREE market emails contain information that can actually make you money. Ask yourself, what email have you read that can do that? Answer = none. Join our list here.
Parm Mann
Elite Round Table
Follow me on twitter: @ParmMannTrader

FSLR shortin case that FSLR will see new low or some morning weakness I will look for short because monthly bear flag odds support that possibility. If you want free service access please take a look at site xpertstocktrader.com and just join us. There are much more live ideas per day

First Solar Daily. Still working on its PennantStill consolidation, look for break of DTL on heavy volume #watchlist


FSLR facing resistance above this level?Hitting upper level of the channel, previous level of resistance just above it. Could go down and follow the path to the lower line of the channel else a breakout to 74-76 range.

Weekly Options Play With FSLR and SCTYLooking at these two charts, it's hard to dispute that there's a relationship between the micro-trends of $FSLR and $SCTY. They're in the same sector, so similar macro-trends are visible; within that sector, they are competitors in several ways so if one goes up it makes sense that the other would go down on a micro level.
The yellow lines are the most recently established R1 and S1 levels of $FSLR if April is included up to today...I included them to show that this most recent peak didn't even reach it, so the unusual volume that drove the price up on its' most recent spike took it to territory where it doesn't really belong (low volume has been sustaining it if you follow the chart down).
Most analysts, most notably those at $GS are expecting a stronger earnings statement and guidance from $FSLR than from $SCTY. So not only is there a natural technical reason for $FSLR to go down, but there's also analyst sentiment reasons for Solar City to go up this coming week and FSLR to drop.
Long story short, I'm buying weekly SCTY calls and $FSLR puts.

FIRST SOLAR ZONES We are expecting their earnings in the coming days. Here are my trading zones. You can switch to a longer time chart i did some drawings in the All time and 5y
Hope it helps you ;)


FSLR ... rdy for a pullback?The stock is in a uptrend so shorting this will be a high risk trade.
However, we see that in the last 5 days, the volume has been decreasing and the candles have been shrinking in size.
This is a possible hint that buy interest @ higher prices is weakening.
Also note that today we have a nice bearish engulfed pattern. Any bulls that bought yesterday are now in pain. this could possibly help drive the price down.
Therefore, I am thinking this could be a possible intraday short tomorrow. Some good targets would be $70 and of course $68.


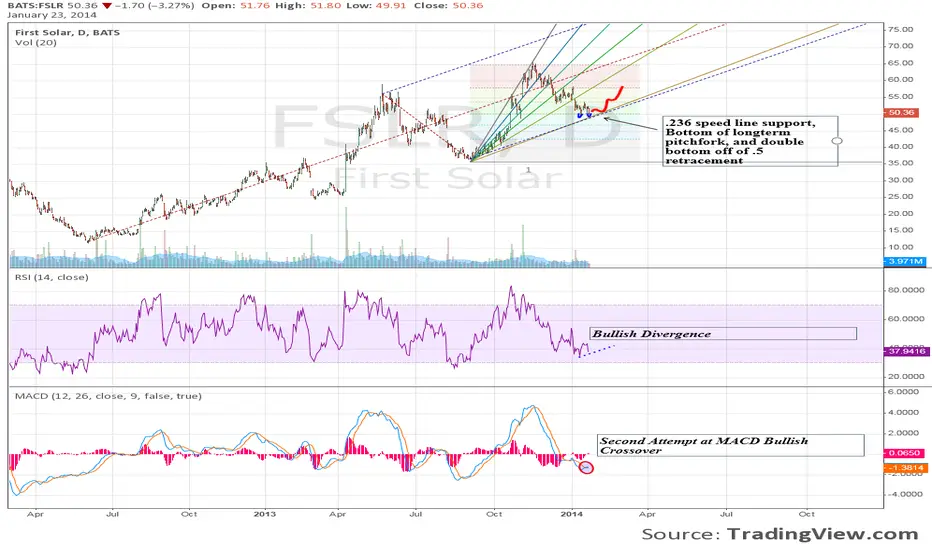
Very Bullish on FSLR.236 speed line support, Bottom of long-term pitchfork, and double bottom off of .5 retracement. Don't really like the company but really like the chart. Also some divergence in RSI and second attempt of bullish MACD crossover.

This offers both scenario nowFrom the last trading sessions, I was looking if the price would go to 58.15 as invalidation level to be extremely short this stock. But then the price has been traded inside of downtrend channel which kept me from buying this.
I still think this looks constructive to the upside but it hasn't offered opportunity to go long just yet.
Instead if the price doesn't break the downtrend trendline and just drops making another leg lower, I might consider to sell the bounce to the previous range bounce at resistance level 55.98 and loo for 49.29.
The reason why I am not really buying this short side is the fact that the RSI hasn't been showing me the strong selling signal and the length of the decline is not showing promising extreme decline at this moment. Will be watching closely if there's good setup for both sides

Decline seems not being supported by volumeI'm gonna look to buy since there's no strong selling on the decline.
It's moving on its channel so I'm gonna look to buy
I'm gonna switch my bias when I see big selling volume decline and price is breaking 48.65 in impulsive manner and out of the channel
