$GSK with a Neutral outlook following its earnings #Stocks The PEAD projected a Neutral outlook for $GSK after a Negative over reaction following its earnings release placing the stock in drift C with an expected accuracy of 77.78%.
G1SK34 trade ideas
GSK Glaxo Smith Kline - Multi Year Lows, A Bargain To Be Bought?GSK is trading around the multi year lows having bounced off of the long term support zone at 1300. I think this is a relative bargain at these levels with GSK being one of the Big Pharma Companies that is still trading way below the starting price for the year.
Pfizer, Johnson & Johnson and Roche are all either positive or around net zero YTD. Novartis is trading slightly lower and so is Merck and Co but not to the extent of GSK making it a bargain in the big Pharma world.
Dividend Yield is current around 5.3% which is high enough to warrant it being a good income stock even if the share price was to remain flat for the next 5 years.
Upside targets are at 1720 which is the next major price resistance zone and and 1850 which is the 18 year highs (formed in 2019).
There is a chance that price could fall back down to 1300 or even the multi year lows at 1235 which would make for a real bargain. But even at the current price of 1378.00 I think over the next 5 years this is a good stock to hold.


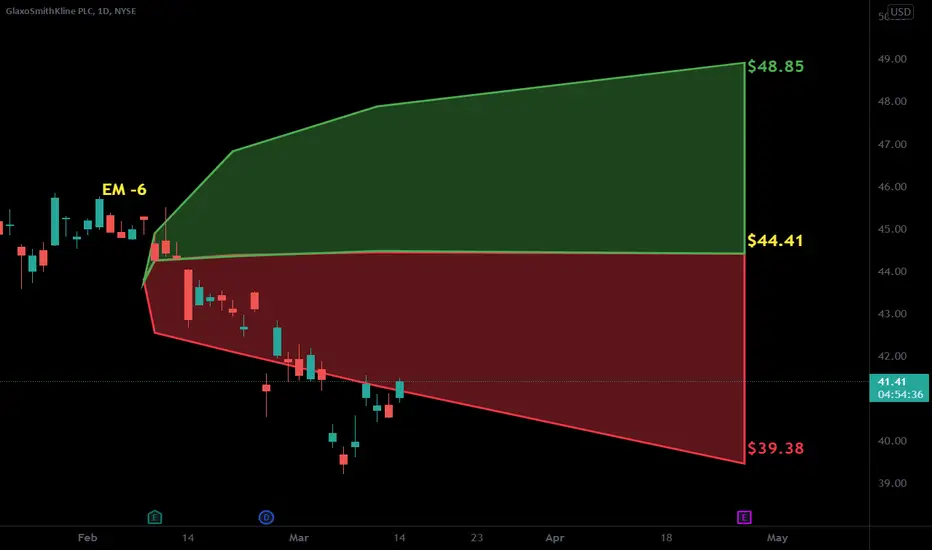
Another Big Pharma Finding The BottomBased on historical movement, the trough could occur anywhere in the larger red box. The final targets are in the green boxes. The pending top should occur within the larger green box as has been the historical case. Half of all movement has ended in the smaller green box. In this instance, the signal indicated BUY on September 17, 2021 with a closing price of 38.93.
If this instance is successful, that means the stock should rise to at least 39.62 which is the bottom of the larger green box. Three-quarters of all successful signals have the stock rise 4.748% from the signal closing price. This percentage is the bottom of the smaller green box. Half of all successful signals have the stock rise 6.534% which is the end point of the black dotted arrow. One-quarter of all successful signals have the stock rise 9.869% from the signal closing price which is the top of the smaller green box. The maximum rise on record would see a move to the top of the larger green box. These are the same concepts for the levels in the red boxes as well.
The ends/vertical sides of the boxes are determined in a similar fashion. The peak of the rise can occur as soon as the next trading bar after signal close, while the max rise occurs within the limit of study at 35 trading bars after the signal. A 1% rise must occur over the next 35 trading bars in order to be considered a success. Three-quarters of successful movement occur after at least 20 trading bars; half occur within 30 trading bars, and one-quarter require at least 33 trading bars.
The black dotted arrow represents median historical movement. Medians are a good metric, but they are just one of many I use when forecasting future movement.
As always, the stock could decline the very next bar after the signal without looking back (therefore the red boxes would not come into play) or the stock may never decline (and the green boxes may never come into play).

$GSK with a Bullish outlook following its earnings #Stocks The PEAD projected a bullish outlook for $GSK after a Positive Under reaction following its earnings release placing the stock in drift A
If you would like to see the Drift for another stock please message us. Also click on the Like Button if this was useful and follow us or join us.
Glaxosmithkline testing golden resistance level 1431.5Glaxosmithkline ($GSK) testing the golden resistance level 1431.5 standing outside of the upper daily Bollinger Band. This level previously reversed Glaxosmithkline down in December of 2020 and in January of this year. Selected Alpha ranks the reversal factor of this resistance level 25 points – making it the strongest golden tracked by the system at the moment. With both the daily RSI and the daily Stochastic in the overbought territory – expect the downard correction from the resistance level 1431.5.

$GSK with a Neutral outlook following its earnings #Stocks The PEAD projected a Neutral outlook for $GSK after a Positive over reaction following its earnings release placing the stock in drift B
If you would like to see the Drift for another stock please message us. Also click on the Like Button if this was useful and follow us or join us.
Glaxo - Elliott takes a stake will this prompt an increase? Bottom of the range looks a good place to buy GSK.
Underperforming though and needs some impetus for share price growth.

$GSK with a Bearish outlook following its earnings #Stocks The PEAD projected a Bearish outlook for $GSK after a Negative Under reaction following its earnings release placing the stock in drift D
If you would like to see the Drift for another stock please message us. Also click on the Like Button if this was useful and follow us or join us.

Ending Diagonal - New uptrend soonAmature trader here. There is a strong pattern on GSK which is now in wave IV of an ending diagonal. Price should go to 1170 but buy around 1200 to show confirmation of a new uptrend.
See here:
This is a weekly chart but over the next two years it may go up 660pts to 1900, could be worth a look
this is not investment advice :), I've lost more than I've won, but at least I understand it now (he says)


Reversal SetupReward/Risk: 3.6/1
Entry: 100.00 or at a lower price
Stop: 34.50
Target: 40.00
Options Play: March 19 37/38 Call Vertical


GSK Long Bounce PlayGSK is one of the biggest names in its sector. Coming off an earnings drop I'm looking for this to bounce back off support back to its previous levels.
Pink line support at 34.75 will cut my position under 34.55 small losses with large upside potential.
Entered 5/21 $39 Calls @.40 will look to average down if needed but they have 100+ days in time. Feel free to go closer to the money if you are playing options for more safety but I took more time and a little bit OTM.
Not financial advice just sharing my thoughts and a simple support bounce play to go long off of.

Penguin says: BRRRRRR Gsk go BRRRRYes Brrr brr. Penguin says BRRRR!!
Gsk Dipping , sets up for the ultimate swing trade!
as traders, These are the types of Opportunities you should be Looking for.
Always look for the best setups, with the Highest % chance of profiting.
This is one of those, - A setup with High chance of profiting.
Penguin says Good buy! Lets reach All time highs for no reason. BRRRRRRRR
Graphs goes BRRR!

GSK Technical Analysis 🧙In the pharmaceutical industry, GlaxoSmithKline ranks as one of the largest companies by total sales. The company wields its might across several therapeutic classes, including respiratory, oncology, and antiviral, as well as vaccines and consumer healthcare products. Glaxo uses joint ventures to gain additional scale in certain markets like HIV and consumer products.
If you understand the idea,🎯 press a thumb up! 👍 Have a question? Don't be shy to ask! 🤓 Interested to study how to analyze charts, follow me!


Double bottom GSK - Target GBX 1,600LSE:GSK
- Double bottom at GBX 1,330
- Divergence RSI/Price
- MACD sloping up
- Trend line broken
- Target price GBX 1,600
What do you think?

GSK Intraday Entry *Breakout Pattern*I previously posted a longterm stock position that I added to my portfolio. This was GSK (GlaxoSmithKline) which is trading at the lower levels of its range and has good growth potential but also a sturdy dividend yield of more than 5% each year.
This stock has seen some strong bullish momentum this week and has broken out of a consolidation structure. The bearish trendline was broken and price is now retesting the trendline and looking for support.
In this current area we have the daily pivot level and also 15minute and 1hr 50EMA's for support. I think if the trendline now holds strong, price will go on to climb up to new yearly highs of 1480p where resistance lies.
