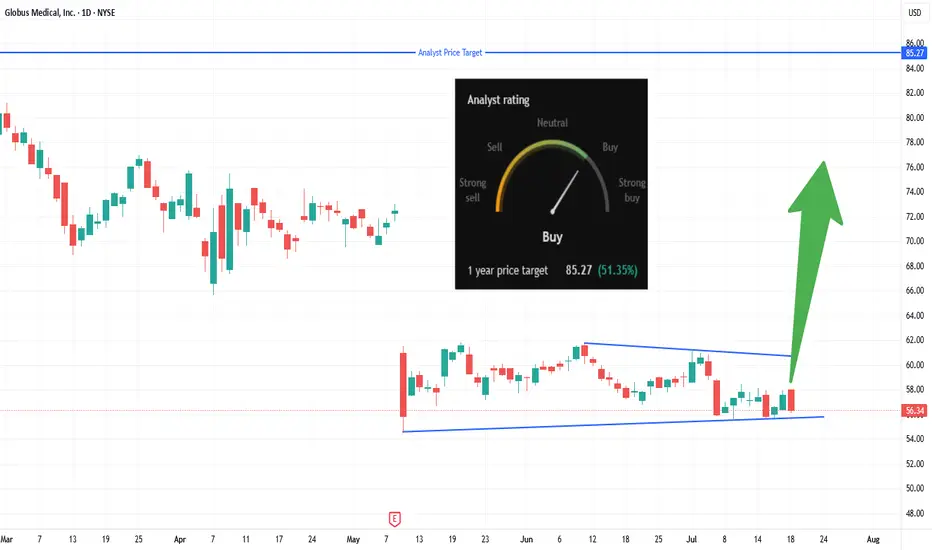
Will GMED Catch a Bid at Channel SupportTrade Summary 📝
Setup: Channel squeeze at multi-week support; volatility contracting.
Entry: Entering at market (current price ~$56.34), bottom of channel.
Stop‑loss: $55.50 (tight stop under structure).
Targets: $62 (channel top), $70+ (gap area), $85.27 (analyst 1-year target).
41,166.667
0.001 BRL
555.18 M BRL
13.58 B BRL
About Globus Medical, Inc.
Sector
Industry
CEO
Keith W. Pfeil
Website
Headquarters
Audubon
Founded
2003
ISIN
BRG2MEBDR002
FIGI
BBG017K4QZL3
Globus Medical, Inc. operates as a medical device company that develops and commercializes healthcare solutions. The firm engages in developing products that promote healing in patients with musculoskeletal disorders. It classifies products into Innovative Fusion and Disruptive Technology. It operates through the United States and International geographical segments. The company was founded by David C. Paul, David D. Davidar and Andrew Iott in March 2003 and is headquartered in Audubon, PA.
Related stocks
GMED breaking out for another bullish move!Globus Medical, Inc. (GMED), a leader in musculoskeletal solutions, is currently exhibiting strong bullish signals.
The stock has maintained a steady uptrend, forming higher highs and lows on weekly charts.
Trading above its 50-day and 200-day EMAs, GMED recently witnessed a golden cross, furthe

Globus Medical: Approaching resistance, is a breakthrough comingWeekly Chart
● The stock has tested the trendline resistance multiple times.
● Currently, it is trading just below this level.
● A breakout above this resistance is anticipated in the near future.
● Following the breakout, the price may increase.
Daily Chart
● A Symmetrical Triangle pattern has

GMED - Up Channel Up channel with the prior up channel acting as the middle band for the larger channel.
I expect price to bounce off the bottom uptrend and continue this trend.
Daily timeframe
The middle resistance has been broken before and it will be broken again.

Looking for a long term entry into Globus MedicalI’m looking for a long term investment in a sea of overvalued bio & tech companies.
Globus Medical caught my eye as a potential candidate after a large dark pool sell and recent pullback in indexes
Globus Medical's index membership is Russell 1000, Russell 3000 and S&P Midcap 400.
Financial Ob

Globus Medical short term weaknessNYSE:GMED
Globus Medical reported strong quarterly results on Tuesday.
Momentum and stochastic indicator suggest short term price weakness as traders take profits.
My personal plan is to reduce holding in small increments so long as selling persists, with the
intention of buying back once the c


$GMED Box SetupSetting up a box long trade into All Time Highs. Volume pattern holding up okay so far but that above than average selling on Friday is a warning. Would like to see couple quite days before it moves up to indicate lack of supply coming to the market. Adding it to my watchlist.

Another good one here Merry Christmas, everyone! I love Santa and love celebrating Christmas since I was born XD
This is a good one as I spot easy charts while they break out. I hope to get your messages back and I'll say "you're very welcome" XDDD
Stay safe, healthy, and wealthy.

Triangle in GMEDScreening through many stocks this morning this was the chart the stuck out to me. A clear triangle. I will be quite surprised if it doesn't play out because of how textbook it looks. Price appears to have broken the triangle upper boundary. A close above this boundary will support continued strengt

See all ideas
Summarizing what the indicators are suggesting.
Oscillators
Neutral
SellBuy
Strong sellStrong buy
Strong sellSellNeutralBuyStrong buy
Oscillators
Neutral
SellBuy
Strong sellStrong buy
Strong sellSellNeutralBuyStrong buy
Summary
Neutral
SellBuy
Strong sellStrong buy
Strong sellSellNeutralBuyStrong buy
Summary
Neutral
SellBuy
Strong sellStrong buy
Strong sellSellNeutralBuyStrong buy
Summary
Neutral
SellBuy
Strong sellStrong buy
Strong sellSellNeutralBuyStrong buy
Moving Averages
Neutral
SellBuy
Strong sellStrong buy
Strong sellSellNeutralBuyStrong buy
Moving Averages
Neutral
SellBuy
Strong sellStrong buy
Strong sellSellNeutralBuyStrong buy
Displays a symbol's price movements over previous years to identify recurring trends.