Traying to catch the Flag-BOHome Depot is consolidating the last upmove 123-139 in form of a bullish flag. Trading below the 38.2 fibo could expand the consolidationLongby The_CannalystUpdated 25
Home Depot "Under Obstruction": Here Are A Dozen Reasons To SellHome-Depot is not under construction, it is "under obstruction" (to near term advances in stock price). Here are the ONE DOZEN negatives in-Home Depot, and why I feel this stock is a sell: 1. Sell Fractal in effect (red rectangle on chart). 2. Alligator jaws opened in tandem with sell Fractal. Alligator feeding in down-trend. 3. Chop indicator (under chart) is below the 38.2 shaded area. This indicates a strong trend coming that (in this case) is down. 4. Phase energy (lower top indicator) is heading LOWER. The action is below the zero line. 5. Momentum (middle top indicator) is the 5/34 measure, and this is a bearish cross and is heading lower. Histogram within is also heading lower. 6. Prices are trading below the Ichimoku Cloud . 8. Prices are trading below the Ki jun-Sen baseline of the Ichimoku Cloud. This is a sell signal. 9. Prices are trading below the thick red Ichimoku Cloud conversion line. This is a sell signal. 9. The red Ichimoku Cloud conversion line direction is heading lower. This is a sell signal. 10. The Ki jun-Sen baseline of the Ichimoku Cloud direction is heading lower. This is a sell signal. 11. The CHOP ZONE indicator (under chart) is red, indicating a down trend. 12. RSI/ Stochastic (top) is heading lower after a bearish cross. In my opinion-HD is heading LOWER. I have given you a dozen negative signs as my objective evidence. Good luck to you in all your trades. Don.Shortby 649brunoPublished 3
Cautious buyI am very cautious this close to the top and thinking the economy will be heading much lower in the coming months BUT this is such a great company. They are very strong and going into a horrible storm season I think we will see some great profits. I won't be putting much into this being my outlook and it's close to the all time highs but it is a good buy non-the-less. Longby johnnys212Published 1
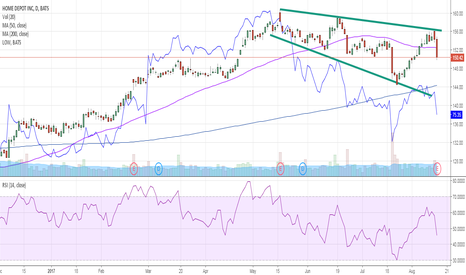
HD about to roll over HD forming a wedge pattern; reject on the top trend line, should fall and find support at the bottom trend line. Shortby JustinStone42Published 0
HD good for a short?A retest on the neckline which was broken and left a pin bar. Shortby hankchefUpdated 1
top of cloud short watch close below 50 ma/same store sales baddiversify with long micro cap and short/retail maturing/rsi weak/money flow bad/macd and stoic about to cross/weak group/by penniestothousandsPublished 0
Home Depot losing strengthHome Depot recently broke its short-term support of 132.09 and a bearish divergence appeared on the weekly chart. This presents a good shorting opportunity with little risk. The long-term trend is still up so cover if it breaks out past 138. 5/26 after closeShortby octradrPublished 110
Home Depot Looking Overvalued I am short this one it is in overvalued condition with rejection from top.Shortby 2Smart2TradeUpdated 3
Home Depot - Double topHD is a slow trending stock, it has been in an uptrend forever. That is why I want to take profits quickly, and not look for a serious correction. Double top on the weekly chart with a bearish divergence, blue impulse. A broken H&S pattern on the daily and red impulse. I am looking for price to reach value on the weekly. Note that the US market looks bearish right now.Shortby vlad.adrianPublished 222
HD: Beakout nearThe market is in a uptilted rectangular congestion. Two possible routes are in the chart.by CsysPublished 0
HD - Wyckoff accumulation within larger distributionPossible LPSY of larger distribution area hit 3-3-16Shortby TraceBustaPublished 2
HD could go either wayOn 18FEB, HD bounced off the linear support and SMA200. Next day produces a bullish hammer candle. From this point there is evidence to argue bullish and bearish. The EMA50 seems to be a strong resistance (12JAN, 29JAN-03FEB) for HD and could be a cap for bullish trend that HD has been presenting. Additionally, the past three days have shown relative highs accompanied by lower lows. There is not a lot of space between resistance and support for HD. Which level will end being stronger?by brianmontgomeryPublished 1
Can HD Bost?This dog of the dow was just ripping through highs, can $HD recover from this? It’s Dividend play? I think it’s depending on your portfolio“S”or even those funds that are only access to brokerage services and what not but, I’m holding 34 shares in this stock on Gurufocus I am bullish long-term of The Home Depot INC. I don’t think it’s a technical perspective that might scream sell. There is no signal on 2/17 but, watch this stock and keep your eyes on this stock. I’m expecting to see $125 break again and make that support and rally from there. I’m a buyer Longby newsdeskPublished 3
HD 2nd retest gap in a row.HD closes with a second bullish retest gap in 2 days closing at minor resistance level from mid OCT and NOV of '15. The fact it follows a morning star reversal adds to the bullish sentiment of the past few days. However, the most recent candle closes on the SMA 200 which could prove to be a resistance point as well. If next candle breaks out of the SMA 200 resistance as well as linear resistance line, I would feel more bullish than bearish in the coming days.by brianmontgomeryPublished 112
S/R Levels Home Depot 1HR Chart Hi all, these are the support / resistance levels for NYSE:HD As you can see marked by the dashed green line we have weekly support at 112.38 which would of been an ideal area to get long on the retest of support. Resistance is currently at 116.30 with 121.07 following shortly. Monthly support is at 109.49 A potential trade: If I hadn't gotten long at the 112.38 retest, than my next option would be to go on a 15 minute chart and day trade the breakout above 116.30 resistance. How? There is a good chance we'll open with a gap above resistance so if that happens there is a good chance the gap will be filled and we will see a retest of 116.30 in which you would keep your eyes on the tape to spot the change of hands between buyers / sellers. Once buyers enter the market then I would get long with two long targets of 118.60 and 120.50 with a stop loss around 114.85. (This would be my trading plan if I wasn't already long HD) This is somewhat an example of my thought process when trading.. You see even if I plan on day trading, I always have a plan in mind for the following day. Which in return prevents me from chasing every single stock that's making a move and also helps remove the emotion out of the equation because I planned ahead for different scenarios, and ways to trade them or simply not trade them. Happy trading guys/girls! =) by Daniel.BUpdated 223