HSHY34 trade ideas

Long Hershey co.Being slightly undervalued, coupled with basic technical analysis and some research into the companies current climate gives you a good a chance as any !!


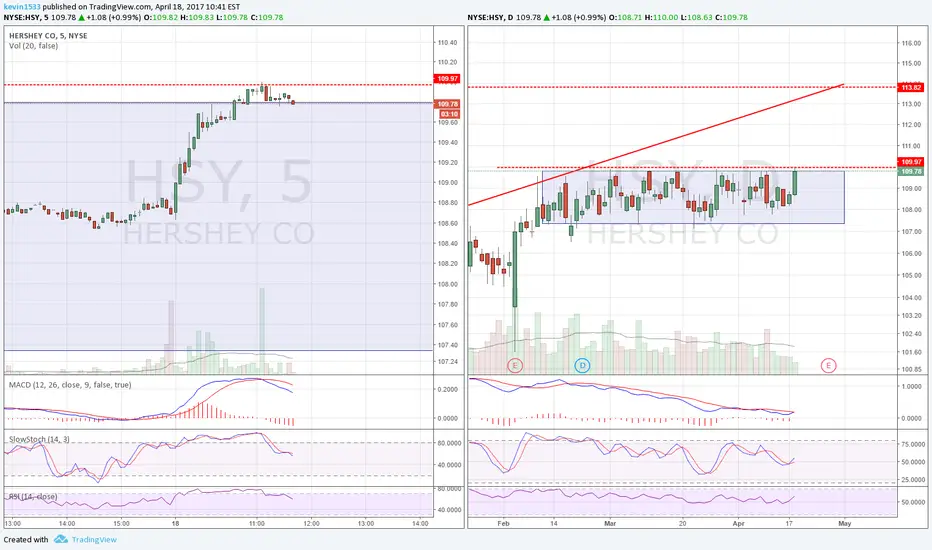
HSY potential move Uptrend has started and if it doesn't break the trendline, we should see $4 move right into major resistance.

Dow drops 666 points :( #6 HSY )In 2014 and 2015 the stock price of this company show problems to reach and close above the 110.00 level then he did a considerable correction between 2015 and 2016
then from July 2016 to January 2018 try again to reach this level beating shyly the 110.00 level and going up around 112.00 to 114.00, the price try in three occasions to beat that level and nothing happens.
Now in our days the past week, the price drops breaking a bullish trend line with a gap (Look the daily Chart) wait for a pullback after the gap.
104.00 is now a key support level
Targets is not my job, my job is to find this kind of pattern and put in the desk of Traders and Managers.
Position sizing, stop loss and targets vary from reader to reader


HSY #411 (Info)Today, Hershey Trust to sell 4.5 million shares of Hershey Co.
What does that mean to stock holders?
The Hershey company agrees to purchase common stock from Hershey Company.
This means that there will be 4.5 million MORE shares for public to buy, which means PRICE will go DOWN
Will be looking to play the bear side of this stock with PUT options for rest of year.


$hsy ready for upward swing!higher time frame in uptrend finding solid support and retraced to .50 level- looking for a bounce upward
mid time frame is forming an ascending triangle with positive momentum and volume
looking for breakout of resistance area of 112.4x to first target of 113.5x area
lower time frame is showing once resistance is broken- there is the least resistance for strong momentum


Hershey selling off?looks like its time for a sell off on HSY
shorting to 618 fib of last higher low.

TOP RECTANGLE ON HSY STOCKSince december HSY trended up until Febrerary 9 where it began to form a reactangle 2.5 MONTHS). If prices breaks the top of the rectancle it should go up. TRADE AT YOUR OWN RISK. I would enter if price goes above 110. with a $2.4 TP


Buy out failThe Hershy family trust has turned down other offers , they seem to be loyal to workers , state country , self
the offer of 107 is below where this price jumped up to of about 115
i am in the July 110 Put @ 2.63
have sold some already in the 3 to 5 range
has a long term hold possibility so i might actually exercise some puts if it drops enoughl

Will need to retrace some of these gainsit will be difficult to build higher highs without some profit taking and retracement.


HSY - Weekly and daily charts alligning for a long tradeThe weekly chart currently stands at the neckline of a double top pattern, where it formed a bullish engulfing candle last week. The Force Index has been oversold a few weeks ago, and is now back inside the channel. A bounce is possible.
Going to the daily chart, a bounce seems imminent. An almost perfect class A bullish divergence on the MACD lines and histogram at strong support with a false breakout below a very strong support level at 88$. Here too, the Force Index has been oversold and is now back inside the channel.
I would use a stop well below 88$ and I would look for a target around 108.


Thats how multiple top are formed.Hershey, the famous chocolate company with branches all over the world, has announced the end of their long term uptrend in late July. Again, breaking a long term uptrend line doesn't mean immediately bear market will take charge tomorrow. As the price may still move higher along the uptrend resistance line until exhaustion takes over. Thats how double top/triple top/multiple top are formed.
Right now, its time to short!
