ICICI Cup and HandleICICI formed a Cup and Handle signal and the same has breakout and retested so hereafter buy signal started
I1BN34 trade ideas

Techno-Funda stock of the week - Icici BankThis is one of the stock all the investors should have in their portfolio. Yesterday Icici bank has finally given a up flag breakout after months of consolidation. This stock has great fundamentals too so please buy Icici bank for the targets of 768, 914.5, 1061, and 1151.5. The SL mentioned in the picture is for the short term traders. Investors should keep a deep SL as per their risk appetite.
View - Medium to long term
Duration - 1 year plus.
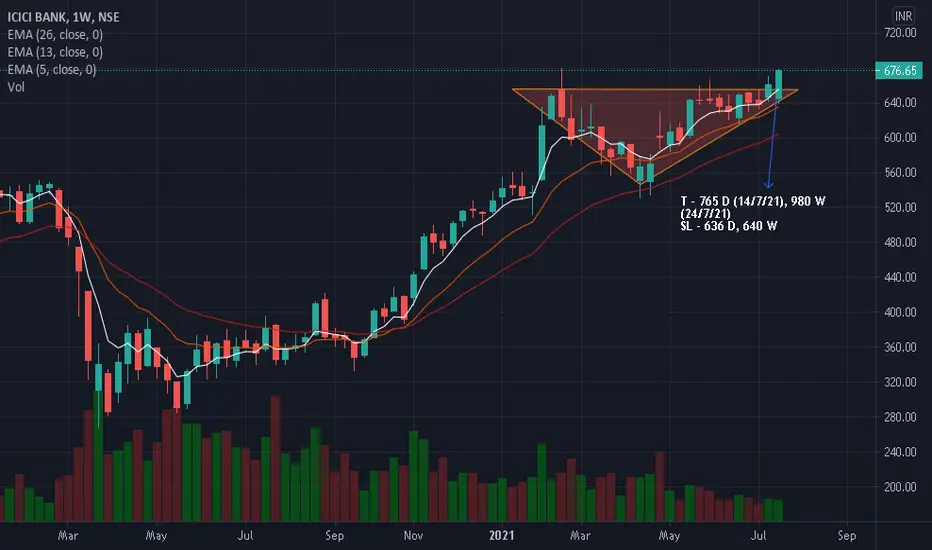
ICICI Bank bullish - nearing breakoutICICI bank is in a ttm squeeze and also forming bullish ascending triangle.


ICICIBANK Daily Bearish ALT Bat , VERTICAL DOTTED LINE is Ultra high volume up bars - trap of Smart Money , Higher volume- Professionals are selling into the public buying
SET UP BECOMES VALID ONLY when RSI is below 70 and IF Price breaks ULTRA HIGH VOLUME Candle LOW & TREND LINE with LOW VOLUMES & with NO DEMAND l.e place for short
POTENTIAL SELL


ICICIBANK - Cup and Handle patternICICIBANK is is urge to break out based on CUP and HANDLE pattern, lets see if its breakout.

Buy ICICI Bank. ICICI bank has given clear breakout on daily chart. One can buy this stock for the target mentioned. However, I would recommend to hold this stock for medium to long term. On weekly chart, this stock has made a huge pole and flag structure. It will give breakout anytime soon. For weekly charts, targets are coming 900+. It’s a very good fundamental company so one can be interested in this stock without doubt.
View - Medium to long term. 1 year plus.


Icicibank From the highs of 680 made in February 2021, the stock has corrected considerably to the
level of 530 and given an impulsive bounce.
one can go Long now or in dips with mentioned key levels in chart.
Wave Structure
Key Levels
Macd in daily positive crossover
Disclaimer
I am not sebi registered analyst
My studies are Educational purpose only
Please consult with your Financial advisor before trading or investing


ICICI BANKIcici Bank holding Trend line since May.
If Fall below 625 and 610. May see downside till 590.
If Icici bank again take support on this trendline we may see upwards 650.

ICICI Bank Triangle Break Out - Long- RSI Bullish
- Stochastic Cross over
- Morning Star (Bullish pattern)
- Wait for Triangle Break Out
Entry = 665
Stop Loss = 653
Target = 770

ICICI Bank at Breakout PointICICI Bank at Breakout Point and according to the RSI diversion it can be break upper tradeline, we should keep eye on this
Entry
Buy: 655
TG- 665/675/699
SL: 642


#ICICIBANK Back with the Bang. #Swing trade#IciciBank trading at important levels. #Swingtrade set up.
Closing above strong #resistance 749.20. it will move towards previous #alltimehigh.
Tgt 1 : 656
Tgt 2 : 660
Tgt 3 : 670/676.
Sustaining above it will lead to 680/690

ICICI Bank trading ideasThis is a tutorial look here how much accurate the trend based fib extension levels worked very well


Swing trade in ICICI Bank Price has taken support at 50ema and bounced and recently closed above that trendline. Moreover RSI indicating strength with high volume. One can take tradeover this for target of 670-80 with sl below the low of recent candle

