AMP Futures - How to use the data windowIn this idea we will show you how to access pin point data information for specific areas on your chart using Tradingview.
ISP1! trade ideas

How to Use Drawing Tools on TradingViewThis tutorial video discusses why and how traders use different types of trading tools, how to access the trading tools in Tradingview, and a few examples of how and why you might apply them.
Learn more about using Tradingview to trade futures with Optimus Futures:
optimusfutures.com
Disclaimer: There is a substantial risk of loss in futures trading. Past performance is not indicative of future results. Please trade only with risk capital. We are not responsible for any third-party links, comments, or content shared on TradingView. Any opinions, links, or messages posted by users on TradingView do not represent our views or recommendations. Please exercise your own judgment and due diligence when engaging with any external content or user commentary.

ES or SP500 Futures (Y25.P2.E1). Bullish macroHi Traders,
Some time back we called this out in our forum to go long and our anchored vwap approach was ideal.
All the best,
S.SAri

S&P 500, is a return to the all-time high reliable?Introduction: The equity market has been on a bullish upswing since mid-April (we invite you to reread our bearish analysis of the VIX at the end of April), against a backdrop of trade diplomacy, particularly between China and the USA. Now that the S&P 500 index has returned to equilibrium since the start of the year (i.e., its annual performance is no longer negative), is it credible from a fundamental and technical point of view to expect the equity market to move towards its all-time record in the coming weeks?
1) A trade appeasement that forged the bullish rally
The United States and China have announced a temporary cut in their respective tariffs, marking a major de-escalation in their trade war. Since May 14, Washington has reduced its taxes on Chinese products from 145% to 30%, including those on fentanyl, while Beijing has lowered its duties from 125% to 10%. This agreement offers a 90-day period in which to pursue negotiations, with no guarantee of success, but with the aim of avoiding a return to tariff increases in the short term.
This truce had an immediate effect on the markets: US equities rebounded strongly, while China suspended certain retaliatory measures, notably on rare earths. On the other hand, the surtaxes put in place during Trump's first term remain in place. Both countries wish to avoid a total economic breakdown, even if the United States maintains a policy of protection in sectors deemed strategic (semi-conductors, steel, pharmaceuticals).
The United States wants to reduce its trade deficit with Beijing, and has hinted that the truce could be extended if dialogue remains constructive. This episode is a reminder, however, that relations remain tense and that a truly comprehensive agreement will take time to materialize, just like the first trade war over the years 2018/2019. Despite everything, appeasement and trade diplomacy appear to be convincing fundamental factors for considering erasing the losses of last March/April's bearish shock. But it will take more in terms of fundamentals to consider surpassing the S&P 500's all-time record, which currently stands at 6166 points on the future contract.
2) Corporate profit forecasts remain optimistic
Of all the fundamental factors driving equity market trends, there is one that has a dominant influence: corporate profit forecasts.
Below, you can see two charts that illustrate the continued marked optimism regarding profit expectations of the companies that make up the S&P500 index. Successful trade diplomacy is essential to sustain these optimistic expectations and enable the S&P500 to return to its all-time high.
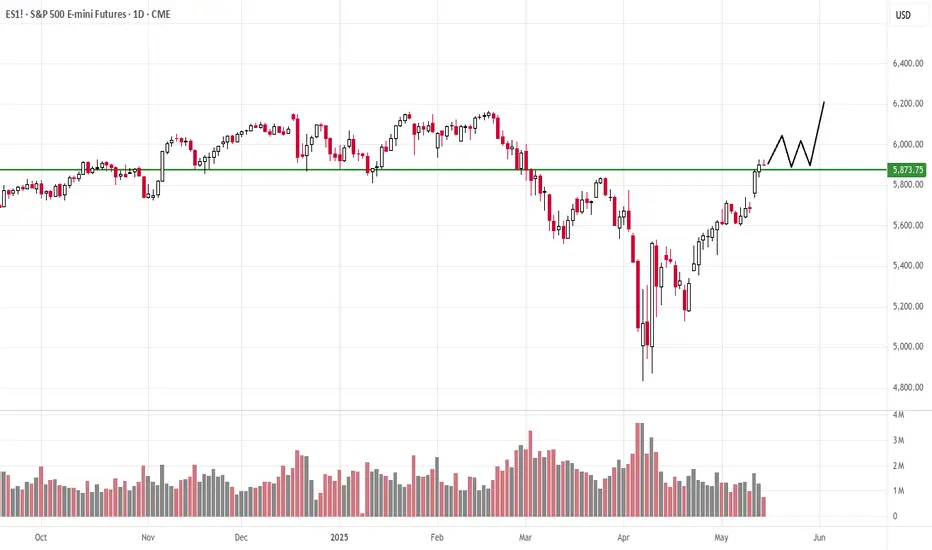
3) Reaching the all-time high on the S&P 500 is credible according to technical analysis of the financial markets
The technical rally in the S&P 500 future contract originated close to the major support at 4800 points, the former all-time high for the year 2021 and chartist guarantor of the underlying uptrend.
The rebound has taken the form of a “V-shaped trough” chart configuration, with a bullish gap recently opened in daily data and the 200-day moving average (in dark blue on the chart below, which displays daily Japanese candlesticks).
Technical analysis suggests that the market can continue to trend towards its all-time record as long as the 5700/5800 chart support is preserved. A breach of this support level on a daily closing basis would invalidate this market view.
DISCLAIMER:
This content is intended for individuals who are familiar with financial markets and instruments and is for information purposes only. The presented idea (including market commentary, market data and observations) is not a work product of any research department of Swissquote or its affiliates. This material is intended to highlight market action and does not constitute investment, legal or tax advice. If you are a retail investor or lack experience in trading complex financial products, it is advisable to seek professional advice from licensed advisor before making any financial decisions.
This content is not intended to manipulate the market or encourage any specific financial behavior.
Swissquote makes no representation or warranty as to the quality, completeness, accuracy, comprehensiveness or non-infringement of such content. The views expressed are those of the consultant and are provided for educational purposes only. Any information provided relating to a product or market should not be construed as recommending an investment strategy or transaction. Past performance is not a guarantee of future results.
Swissquote and its employees and representatives shall in no event be held liable for any damages or losses arising directly or indirectly from decisions made on the basis of this content.
The use of any third-party brands or trademarks is for information only and does not imply endorsement by Swissquote, or that the trademark owner has authorised Swissquote to promote its products or services.
Swissquote is the marketing brand for the activities of Swissquote Bank Ltd (Switzerland) regulated by FINMA, Swissquote Capital Markets Limited regulated by CySEC (Cyprus), Swissquote Bank Europe SA (Luxembourg) regulated by the CSSF, Swissquote Ltd (UK) regulated by the FCA, Swissquote Financial Services (Malta) Ltd regulated by the Malta Financial Services Authority, Swissquote MEA Ltd. (UAE) regulated by the Dubai Financial Services Authority, Swissquote Pte Ltd (Singapore) regulated by the Monetary Authority of Singapore, Swissquote Asia Limited (Hong Kong) licensed by the Hong Kong Securities and Futures Commission (SFC) and Swissquote South Africa (Pty) Ltd supervised by the FSCA.
Products and services of Swissquote are only intended for those permitted to receive them under local law.
All investments carry a degree of risk. The risk of loss in trading or holding financial instruments can be substantial. The value of financial instruments, including but not limited to stocks, bonds, cryptocurrencies, and other assets, can fluctuate both upwards and downwards. There is a significant risk of financial loss when buying, selling, holding, staking, or investing in these instruments. SQBE makes no recommendations regarding any specific investment, transaction, or the use of any particular investment strategy.
CFDs are complex instruments and come with a high risk of losing money rapidly due to leverage. The vast majority of retail client accounts suffer capital losses when trading in CFDs. You should consider whether you understand how CFDs work and whether you can afford to take the high risk of losing your money.
Digital Assets are unregulated in most countries and consumer protection rules may not apply. As highly volatile speculative investments, Digital Assets are not suitable for investors without a high-risk tolerance. Make sure you understand each Digital Asset before you trade.
Cryptocurrencies are not considered legal tender in some jurisdictions and are subject to regulatory uncertainties.
The use of Internet-based systems can involve high risks, including, but not limited to, fraud, cyber-attacks, network and communication failures, as well as identity theft and phishing attacks related to crypto-assets.

May 14th Trade Journal & Stock Market AnalysisEOD accountability report: +452
Sleep: 6 hour, Overall health: 👍
Been super chillax, having some great trading days 😄
Daily Trade recap based on VX Algo System
9:30 AM Market Structure flipped bearish on VX Algo X3!
10:37 AM SMH/Chip Stock Sell Signal X10
1:00 PM Market Structure flipped bearish on VX Algo X3!
2:34 PM Market Structure flipped bullish on VX Algo X3!
3:01 PM VXAlgo YM X1 Sell Signal
3:30 PM Market Structure flipped bearish on VX Algo X3!
Next day plan--> Under 5875 = Bearish with X7 sell signal, Over 5900 = Clearly bullish breakout
Video Recaps -->https://www.tradingview.com/u/WallSt007/#published-charts

Sideways marketThe structure in the S&P 500 daily chart implies the set up for a sideways market for Thursday's action. It's important to remember that PPI and retail sales will be announced on Thursday and could add volatility to this market.

S&P 500 Technical Analysis: Testing the Axis LineThe S&P is now reaching the axis line, where heavy selling emerged months ago. It’s reasonable to expect a pause at this level, followed by a continuation of the strong uptrend.
Volume Analysis
Looking at the recent chart pattern, we can observe that the volume became quite climactic right on the break. It’s particularly noteworthy that the current bar is at the same level as previous significant price action. This pattern suggests we’re essentially going through the same cycle again, repeating familiar market behavior.
The Critical Axis Line
This axis line is critical for traders to monitor. If the market can successfully break above this level and then consolidate, spending sufficient time above this resistance, we’re likely going to experience a rally.
Chart Pattern Observations
The chart shows several technical elements:
Multiple touch points along the resistance level
Previous price action at similar levels
The market cycling through similar patterns again
Conclusion
The S&P is at a critical juncture, testing a well-established axis line. If we can get above it and then just consolidate, spending some time there, we’re probably going to have a rally.
ID: 2025 - 0105.14.2025
Trade #10 of 2025 executed.
Trade entry at 37 DTE (days to expiration).
Trade construct is a PDS (put debit spread) at Delta 15 combined with a PCS (put credit spread) at Delta 15. Overlapping short strikes give it the "unbalanced" butterfly nomenclature.
Sizing and strike selection is designed to keep the risk/reward "AT EXPIRATION" to a 1:1 risk profile. This lets charm work it's magic (second order greek), while exploiting the fact that this is a non-directional bias. The process is a disciplined and systematic approach letting time decay evaporate the extrinsic time value from the short options until target profit is achieved.
Target profit is 5% ROI
Happy Trading!
-kevin

Bullish Momentum ContinuesBullish Momentum continues but a retracement is very well needed. We are currently at 2.5 STDV level and my final target is 4 STDV drawn on the chart but before we get there, I do want to see a solid retracement down.
We also pushed through that monthly FVG so retracement after such a displacement is seen very often. We will either push a bit higher first then back to FVG then to 4 STDV or retrace now, perhaps to CE of that FVH then push to 4 STDV.

Can upside momentum be maintained?Can the upside momentum be maintained in the daily chart on the S&P 500? The momentum does continue at a respectable pace to the upside and was fundamental support the expectation is to see new highs on Wednesday. The upside objective is 5970.

LONG ESNeeds to break and hold above $5880 before anything*
SL below $5800 (Last Target)
TP $6200 BABY!
You guys might call me crazy...
but here is my opinion analysis....
Inflation numbers coming in tomorrow, while Inflation is expected to be higher this is what I am thinking..
I think inflation numbers are going to come back at an unexpected low due to a synthetic event with the tariffs and a pause on BUYING.
what happens when people stop buying for a little? price goes down...
This is a shot in the dark but I think its going to confuse the market majorly because at the same time the Feds will be looking at it from the point of lets wait and see. This can trigger a massive sell off in June if people are rallying. We will know once the numbers are released tomorrow morning at 530AM.
In the meantime...I think Greed is in...with ES as high as the $6200 if this happens.

May 12th Trade Journal & Stock Market Analysis May 12th Trade Journal & Stock Market Analysis
EOD accountability report: +778.75
Sleep: 6 hour, Overall health: 👍
Just arrived to BKK, and adjusting to the new place.
day 5 of taking the morning pill stacks consistency and noticing the lions mane working pretty effectively with the new supplements.
trading has been very clear and easy.
Daily Trade recap based on VX Algo System
— Yesterday at 9:30 AM Market Structure flipped bearish on VX Algo X3
Yesterday at 1:00 PM Market Structure flipped bullish on VX Algo X3!
— Yesterday at 1:21 PM VXAlgo ES X1 Sell Signal
— Yesterday at 1:30 PMVXAlgo ES X7 Sell signal,
3:37 PM Market Structure flipped bearish on VX Algo X3!
— Yesterday at 3:50 PM VXAlgo ES X1 Buy signal (triple buy)
Next day plan--> Under 5875 = Bearish with X7 sell signal, Over 5900 = Clearly bullish breakout
Video Recaps -->https://www.tradingview.com/u/WallSt007/#published-charts

Buyers are here look for a small rally.Buyers are in the S&P 500 on Monday. Look for the continuation of that movement to the upside but not a dramatic move. The objective to the upside would be 5910.

ES1! LongES1! is now net long on the regression break.
I ma considering my options this morning on the whole market.

How to Set Up Multi-Timeframe Analysis (MTF) in TradingViewThis tutorial video explains what a time frame is, why traders use multiple time frames for their analysis, and how to set them up in TradingView for futures and other products.
Disclaimer:
There is a substantial risk of loss in futures trading. Past performance is not indicative of future results. Please trade only with risk capital. We are not responsible for any third-party links, comments, or content shared on TradingView. Any opinions, links, or messages posted by users on TradingView do not represent our views or recommendations. Please exercise your own judgment and due diligence when engaging with any external content or user commentary.

Equity markets look bullishIf the weekly candle closes as it has started - or better - it's a crystal clear bullish reversal for the equity markets.

Liberation, Altercation & Boom: US China Trade talks CME_MINI:ES1!
Pointing to our previously written blog post (Liberation, Altercation or Doom) on March 31st. A mix of all scenarios played out.
Global universal tariffs with reciprocal tariffs layered on top. It resulted in a huge sell-off on April 2nd.
After months of tit-for-tat tariffs and growing economic friction, the US and China have agreed to hit pause. In a joint statement that’s given markets some breathing room, both countries announced a 90-day suspension on a large portion of their punitive tariffs—an initial step toward dialing back tensions and restarting dialogue.
Key Tariff Measures from US-China Joint Statement (90-Day Pause)
US Tariff Reductions:
Tariffs on Chinese goods were reduced from 145% to 30% for a 90-day period.
24 percentage points suspended, leaving a 10% base tariff in place.
China Tariff Reductions:
Tariffs on US goods reduced from 125% to 10% for the same 90-day period.
China also suspends 24 percentage points of additional ad valorem duties.
Retains a 10% baseline tariff on US imports.
Non-Tariff Measures: China to suspend or remove all non-tariff countermeasures imposed since April 2.
Includes sanctions on certain US companies.
Lifts export controls on some critical minerals.
Timeline & Commitment:
Both parties agree to implement these actions by May 14.
Commitment to continue trade and economic talks through a new bilateral mechanism.
Talks may be held in alternating locations (US/China) or via third-party venues.
No Agreement On:
Currency policy.
E-commerce “de minimis” exemptions.
Sector-specific tariff frameworks.
Future Key Dates and Timeline:
May - Potential US semiconductor tariffs.
May/June - Potential US pharmaceutical tariffs.
July 8th - 90-day tariff lowering for "worst offenders" expires.
July 14th - US tariffs on Mexican agriculture goes into effect.
August 10th - US-China tariff relief expires.
Was this really mutual or just a game of chicken?
There’s an argument to be made that this is more of a tactical pause than a full reconciliation. With China’s GDP in purchasing power parity terms now surpassing that of the US, and its continued technological advancements across sectors like aerospace, semiconductors, and critical minerals, the balance of economic leverage is shifting. For investors, this isn’t just about tariffs—it’s about the evolving structure of global trade.
Geopolitical undercurrents continue to shape the backdrop. China’s strategic influence in regional security, technology supply chains, and commodity access adds another layer to its negotiating position. Recent developments—such as China's reassertion of dominance in strategic corridors and growing control over key mineral exports—suggest its economic posture is becoming more assertive. This, in turn, has implications for US firms dependent on Chinese inputs or facing retaliatory restrictions.
In short, the 90-day window presents a tactical opportunity, but the structural story remains complex. Investors would be wise to monitor not just tariff updates, but broader shifts in trade alliances, export controls, and supply chain vulnerabilities—especially in sectors like tech, energy, and defense-adjacent industries.
ES Futures:
ES Futures and risk on assets are positive across the board following this announcement.
Key Levels:
Key LVN/ Key LIS: 5861-5837.25
200 Day MA: 5872.99
0.786 Fib Retracement level: 5921.75
0.618 Fib Retracement level: 5688.75
pWkHi: 5741
mCVAL 2025: 5639.75
Expectations for the week ahead:
US CPI and Retail Sales data on the docket this week along with slew of FED speakers.
Scenario 1: Risk on
ES Futures get back above 200-day moving average clearing the key LVN resistance zone and our key LIS, head towards 0.786 Fib retracement level before pulling back and consolidating for the remainder of the week.
Example trade:
Entry: 5861
Stop: 5837
Target: 5921.75
Risk: 96 ticks
Reward: 243 ticks
Risk/Reward ratio: 2.5 R
Scenario 2: Further consolidation
Markets consolidate below the key LVN resistance zone and prior weekly high.
Example Trade:
Entry: 5837
Stop: 5861
Target: 5741
Risk: 96 ticks
Reward: 384 ticks
Risk/Reward ratio: 4 R
Glossary:
VA: Value Area
VPOC: Volume Point of Control
VAL: Value Area Low
C: Composite (used as a prefix: VA, VAL, VAH, VPOC, etc.)
mC: micro Composite (used as a prefix: mCVA, mCVAL, etc.)
LNV: Low Volume Node
LIS: Line in Sand
Important Notes:
These are example trade ideas not intended to be a recommendation to trade, and traders are encouraged to do their own analysis and preparation before entering any positions.
Stop losses are not guaranteed to trigger at specified levels, and actual losses may exceed predetermined stop levels.

Long ESSwing from last week, back at breakeven.
Entry with possible support at around $5650 (I entered early…)
SL below $5600-
TP $5800 and lets let 1 runner go to $6000 if AMD earnings goes well!

SP500 Weekly Action Areas & Price Targets 12/05/25In this update we review the recent price action for the E-mini SP500 and identify high-probability action areas and price targets for the trading week ahead. To review today's video analysis, click here!

ES - Day Trading Analysis With Volume ProfileOn ES , it's nice to see a strong buying reaction at the price of 5684.
There's a significant accumulation of contracts in this area, indicating strong buyer interest. I believe that buyers who entered at this level will defend their long positions. If the price returns to this area, strong buyers will likely push the market up again.
(FVG) - Fair Value GAP and high volume cluster are the main reasons for my decision to go long on this trade.
Happy trading
Dale

Cautious Optimism: What’s Next for the S&P 500US500 My Outlook for the Next Week:
Given the relentless bullishness on the chart and the current backdrop, here’s how I see the next week playing out:
Short-Term: The S&P 500 may continue to consolidate or experience mild pullbacks as investors digest recent gains and await fresh catalysts. Sector rotation could create choppiness, especially if tech underperforms.
Catalysts: Watch for key economic data (inflation, employment, Fed commentary) and any major earnings surprises. These could trigger renewed momentum or a sharper correction.
Risk/Reward: The risk of a sharp correction is rising, but the underlying trend remains bullish unless there’s a significant negative surprise. A shallow pullback or sideways action would be healthy and could set up the next leg higher if fundamentals remain intact.
In summary: The S&P 500’s relentless bullishness is being tested by mixed sentiment and cautious analyst forecasts. Fundamentals are still supportive, but risks are rising. For the next week, expect consolidation or mild volatility, with the potential for renewed upside if economic data and earnings remain strong. Stay nimble, watch for sector rotation, and be prepared for both short-term pullbacks and longer-term opportunities.
Not financial advice.

Everything Ready for a Bullish Implulse toward 5770Dear traders. As you may notice as explained on the chart, everything is ready for a bullish move towards 5770 and beyond. Let's See!

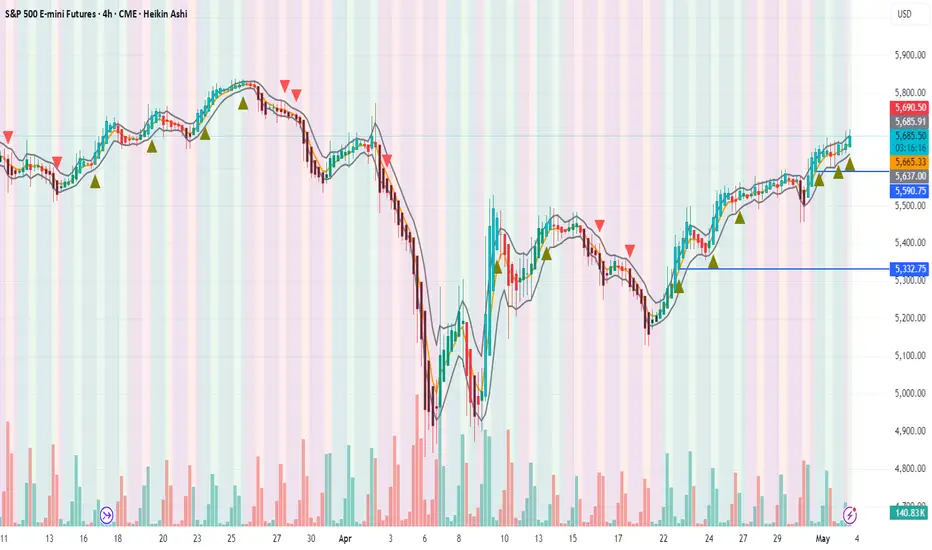
S&P 500 – iSpark Catches Clean Breakout from 5330 to 5700📢 The iSpark Indicator caught a strong breakout on the S&P 500 Index (4H chart) around the 5330 level , which was followed by a sequence of bullish moves — now reaching the 5700 mark.
🔍 Currently, price is testing the 10 EMA at 5710 , which is acting as a short-term resistance . A clear break and sustained move above 5710 could trigger the next leg higher toward 5750–5775 .
🎯 Holding positions? Stay in with a stop-loss at 5600 to manage risk.
📉 Fundamental caution: As always, keep an eye on macro headlines — unexpected global turmoil or sharp trade commentary (e.g., tariffs) may influence momentum
💡 This entire setup was captured early using the iSpark Indicator , designed to detect high-conviction breakouts across timeframes.
📬 Premium users interested in testing the iSpark Indicator can DM me for a hands-on walkthrough.
#SP500 #ES1! #Breakout #iSpark #TechnicalAnalysis #TradingStrategy #EMA #TrendFollowing #SPX #TradingView #SNP500